

Visual Overview


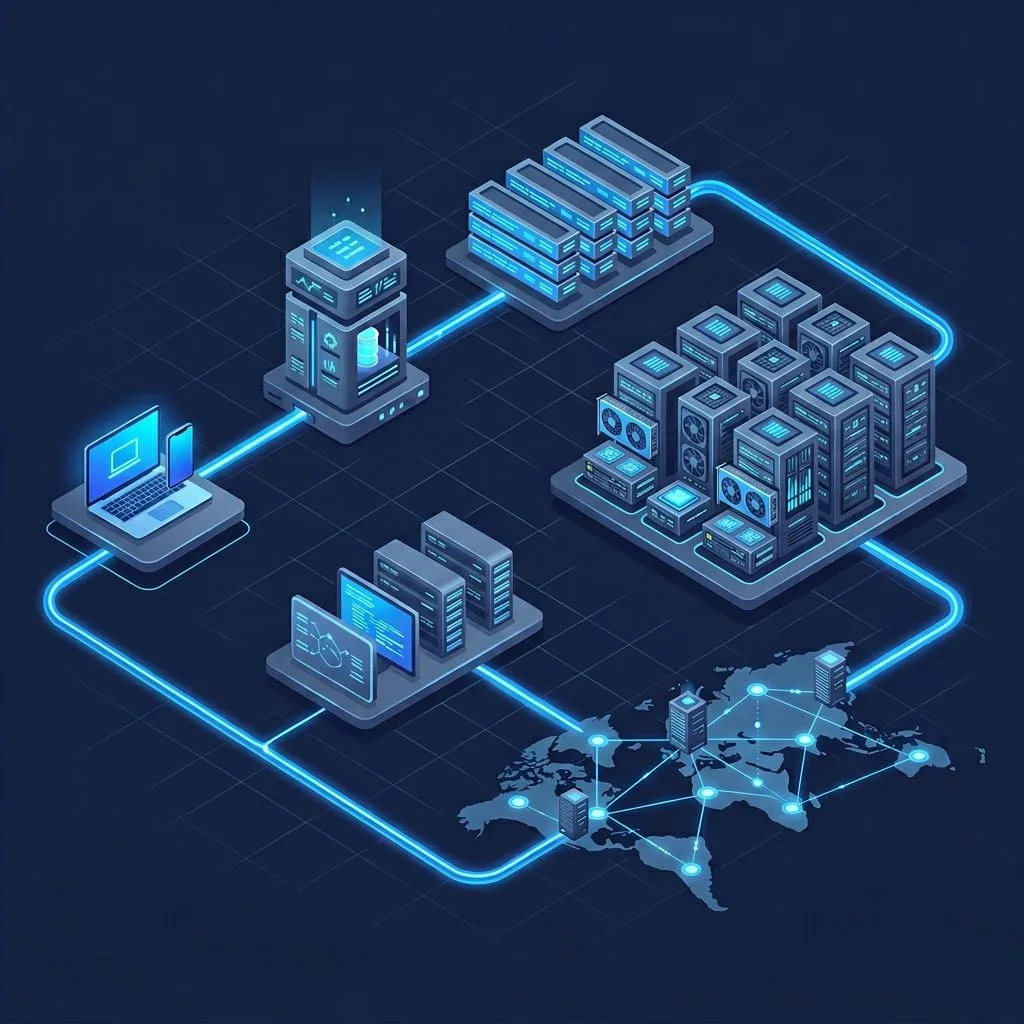
Architecture Flow Diagrams
Deploying AI models to production is fundamentally different from running them in a notebook. GPU memory management, container orchestration, async processing, and auto-scaling all introduce challenges that most tutorials skip entirely.
This article is a comprehensive, end-to-end guide based on a real production system. It covers everything from AKS cluster creation to the moment a processed result lands in the user's hands — seven layers deep.
1. Setting Up AKS for GPU Workloads
The most critical decision when creating an AKS cluster for AI workloads is the node pool strategy. GPU workloads must run on a dedicated user pool — running GPUs in the system pool wastes money and creates resource contention.
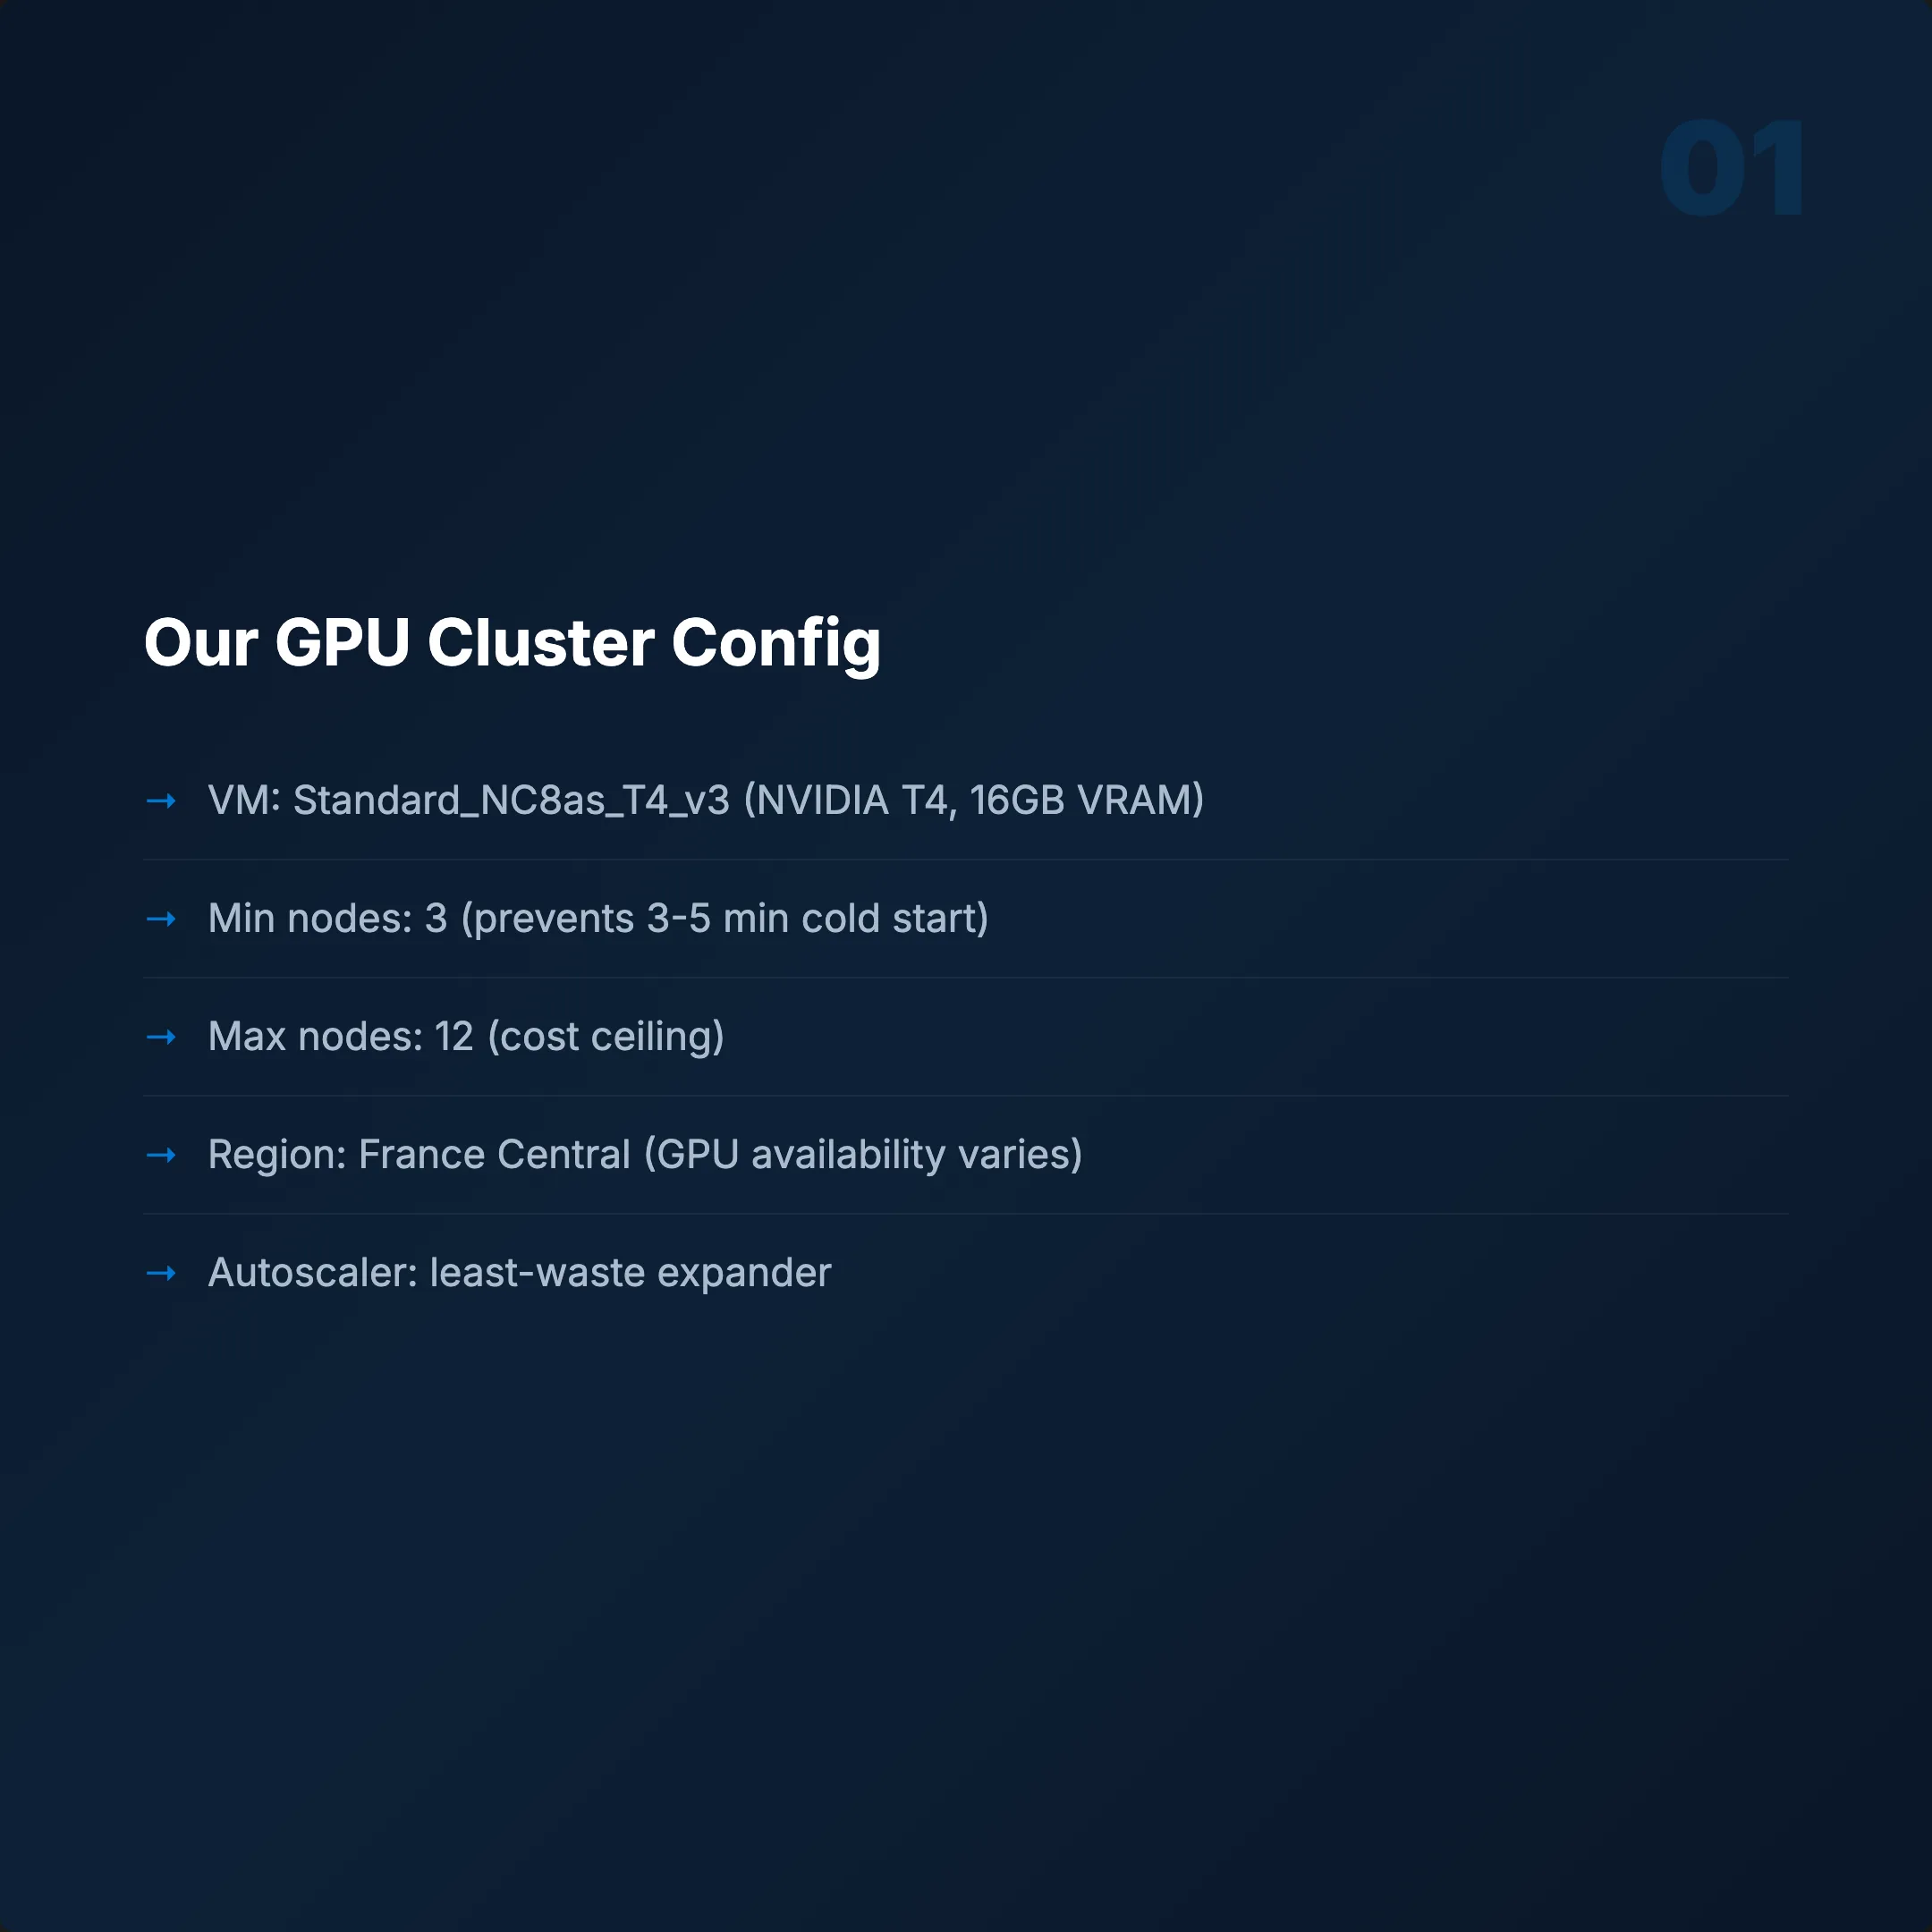
Cluster Configuration
- VM: Standard_NC8as_T4_v3 (NVIDIA T4, 16 GB VRAM)
- Min nodes: 3 (prevents cold start — GPU spin-up takes 3–5 minutes)
- Max nodes: 12 (cost ceiling)
- Region: France Central (GPU availability varies by region)
- Autoscaler: Cluster autoscaler with
least-wasteexpander
The least-waste expander picks the node type that wastes the fewest resources. When you have multiple VM options, it chooses the most efficient one.
Common Pitfalls
- GPU nodes aren't available in every region. Run
az vm list-skusbefore you commit. - Spot instances for GPU? Risky. A preempted node mid-inference means lost work.
- Min 3 nodes is not optional. Users won't wait 3–5 minutes for a cold GPU to spin up.
2. Turning an AI Model into a Production API
We use FastAPI + Uvicorn — async support, auto-generated OpenAPI docs, and faster than Flask. But the framework isn't where people fail. It's the GPU concurrency model.
Four Critical Decisions
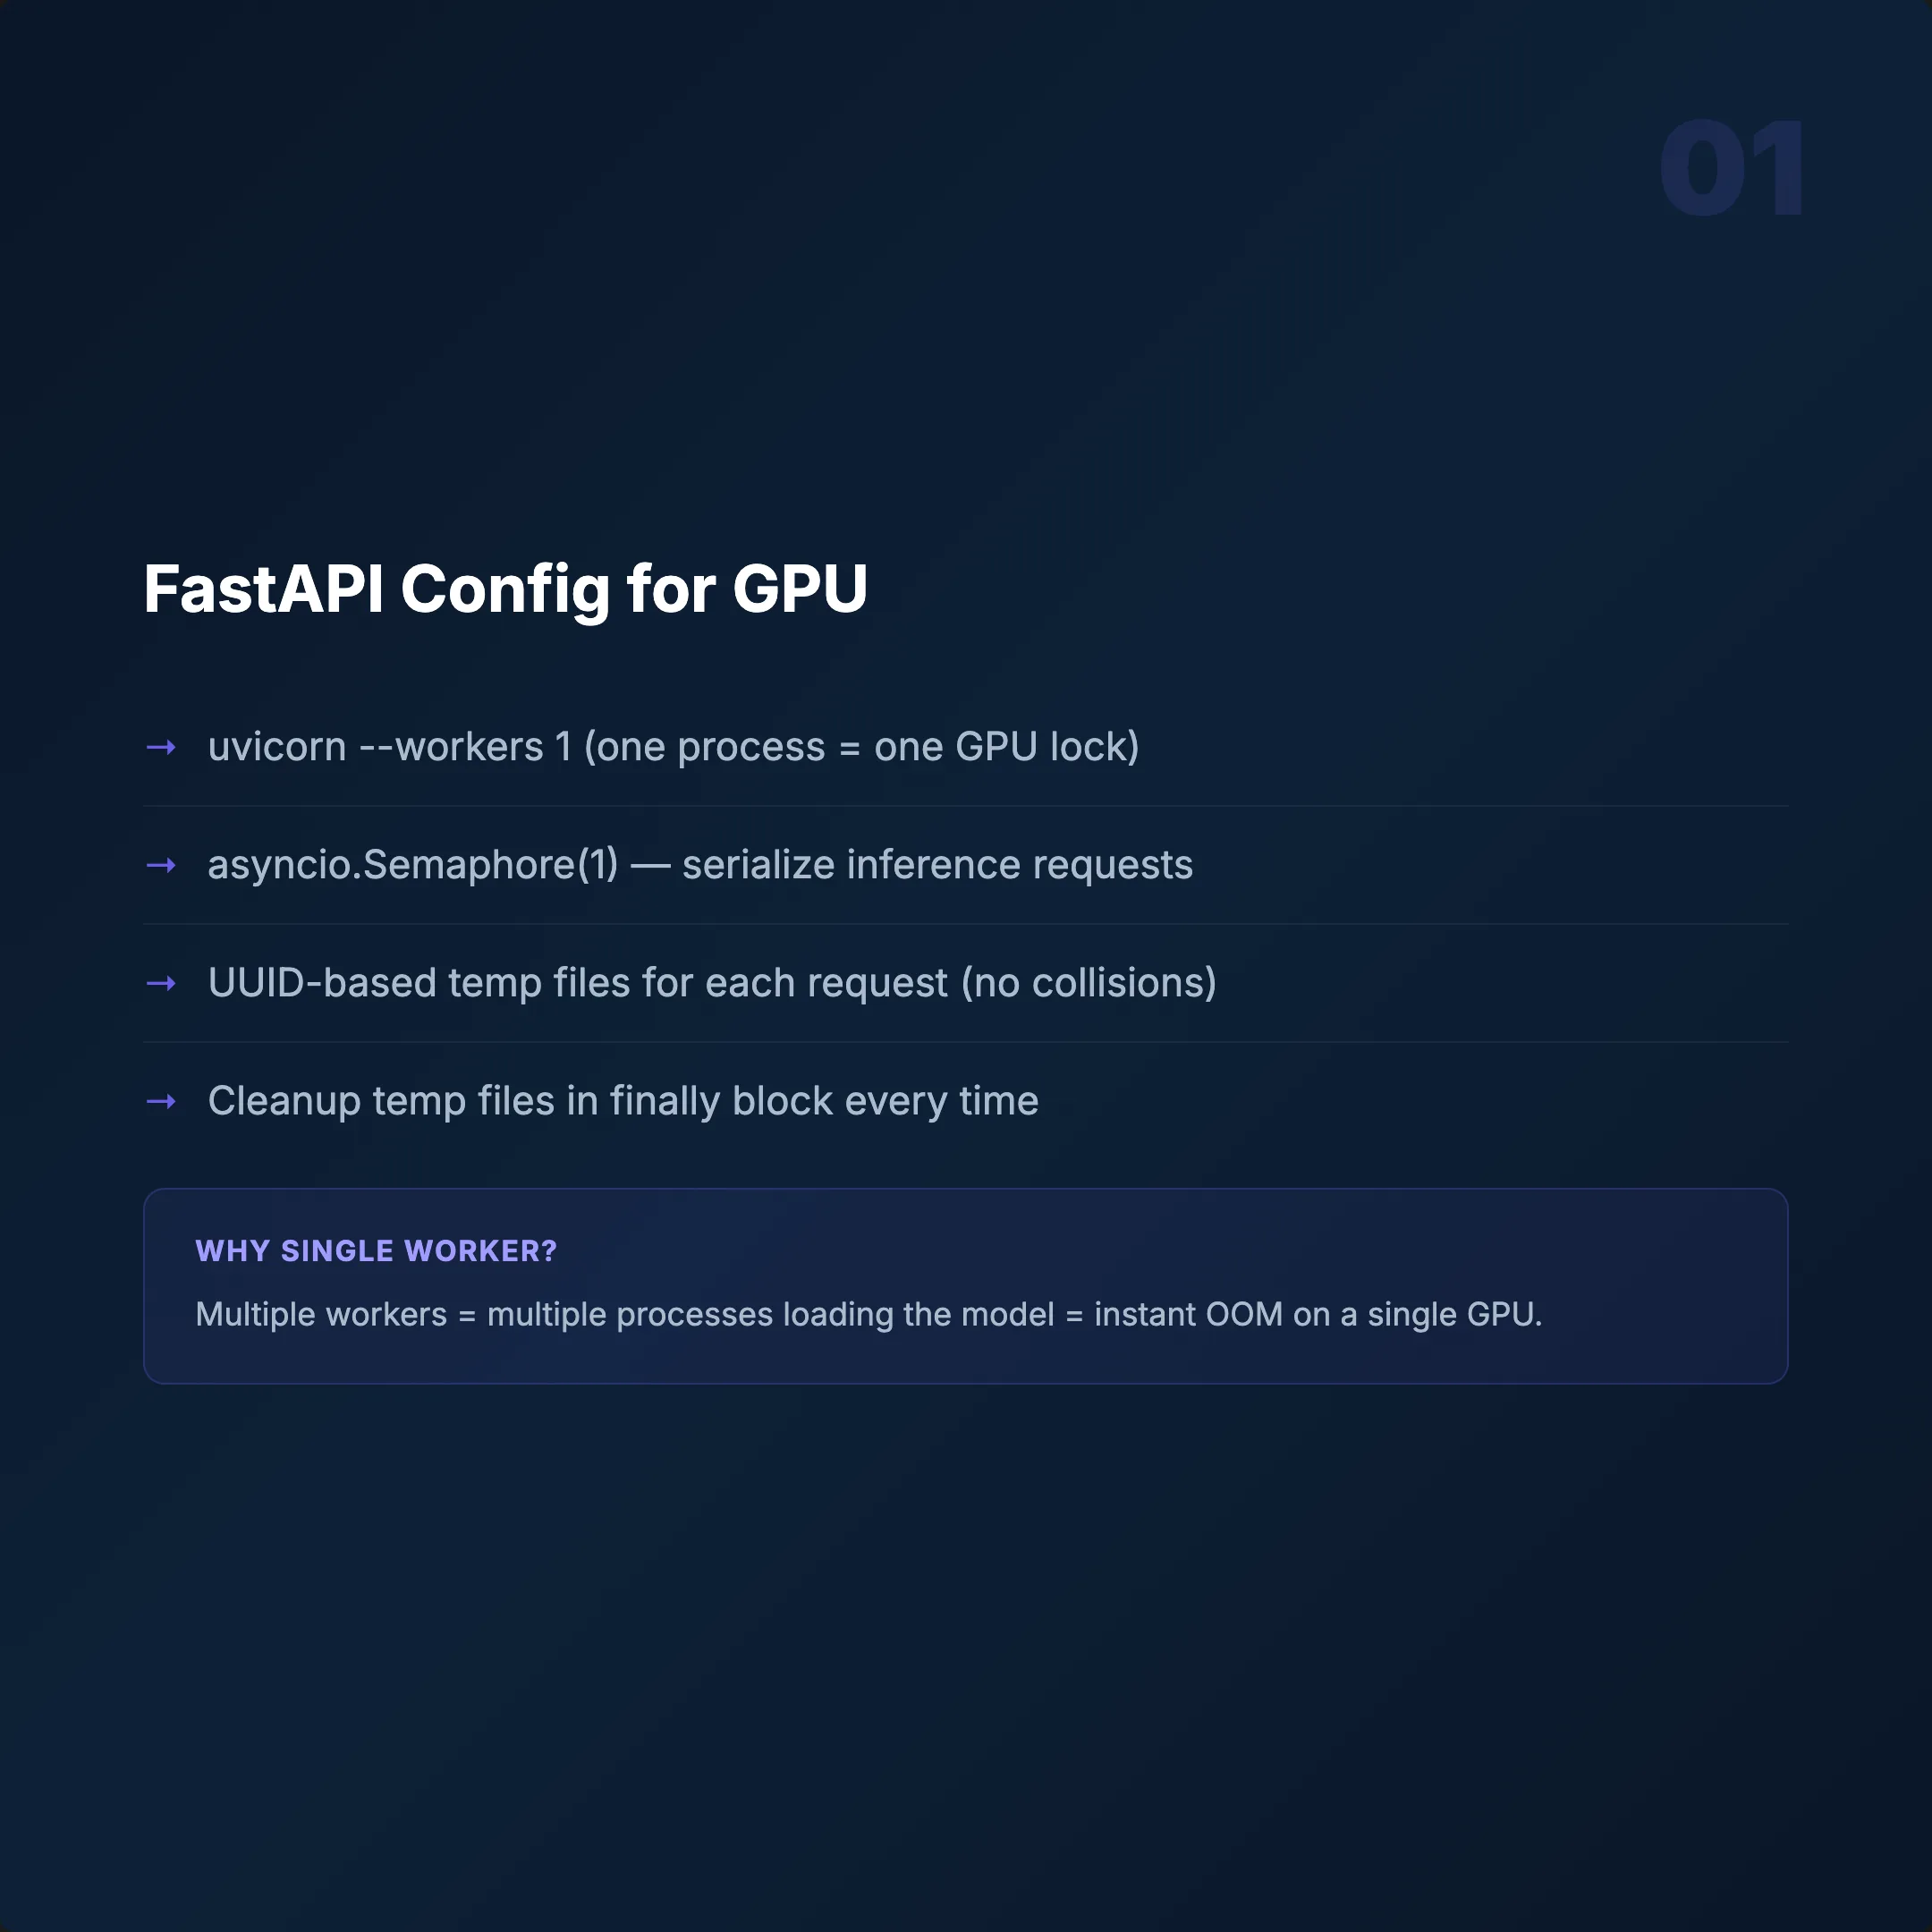
Single Worker: uvicorn --workers 1
GPU memory isn't thread-safe. Concurrent inference causes memory collisions and crashes. Scale with more containers, not more threads.
Semaphore(1)
Only one inference per container at a time. A second request waits. Simple, predictable, stable.
Model Loading at Startup
Load models once at container start, not per request. ONNX Runtime GPU gives 30–40% faster inference compared to raw PyTorch.
Temp File Management
UUID-based file names per request with cleanup after processing. Skip this and /tmp fills up — the container dies silently.
Health Endpoints — Keep Them Separate
/work→ Liveness (is the container alive?)/health→ Readiness (is it busy or free?)
If you combine them, Kubernetes can't distinguish dead from busy. It will restart healthy containers mid-inference.
3. Building a GPU Docker Container
A GPU container is not a normal Docker image. CUDA, cuDNN, PyTorch, ONNX Runtime — all interdependent. Version mismatch is the #1 failure mode.
Base Image and Dependencies
- Base:
nvidia/cuda:12.1.1-cudnn8-devel-ubuntu22.04 - Python: 3.10
- PyTorch: 2.0.1+cu118
- ONNX Runtime GPU: Separate install (pip default is CPU-only!)
CUDA Version Mismatch — Why It Works
CUDA 11.8 PyTorch on a CUDA 12.1 runtime? Yes. PyTorch bundles its own CUDA libraries. The host runtime handles driver-level operations. They coexist. This trips up a lot of people.
The Most Important Rule: Download Models at Build Time
Add RUN python download.py in your Dockerfile. Bake model weights into the image.
- Without: Every pod spends 2–5 min downloading before serving.
- With: Cold start drops to under 10 seconds.
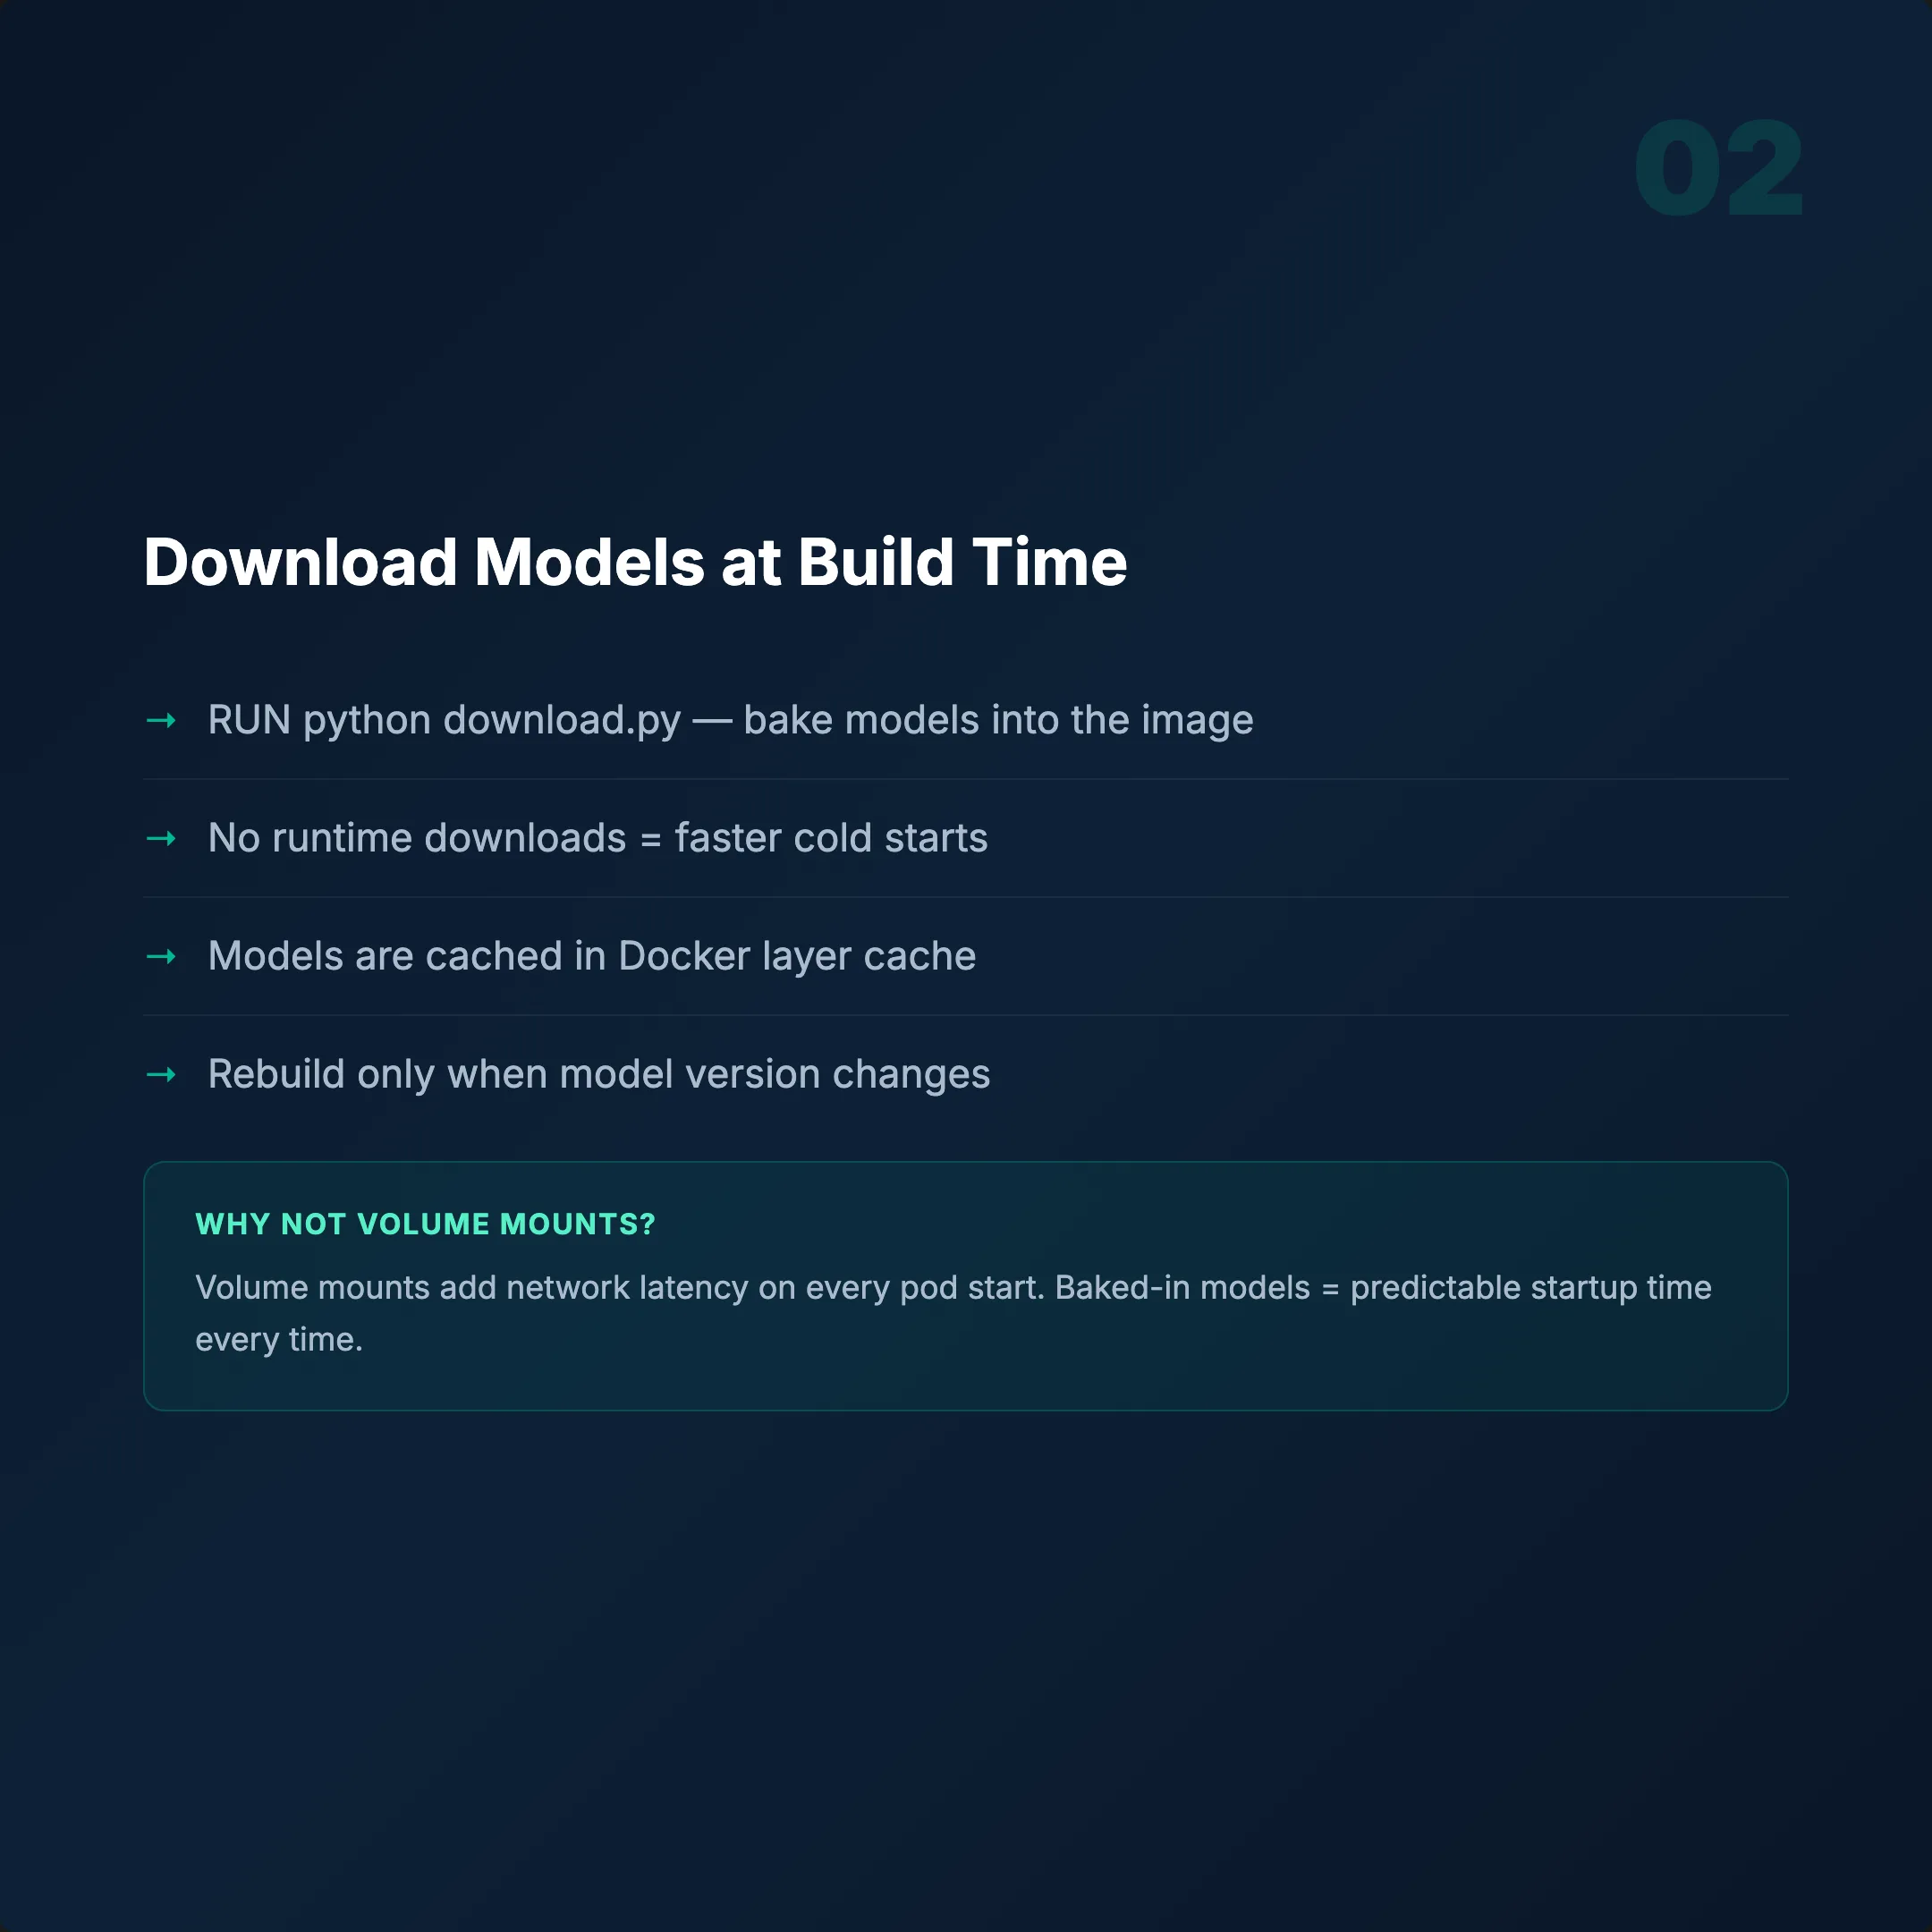
Image size will be 12–18 GB. Normal for GPU containers. Multi-stage builds help remove build tools, but GPU libraries are large. Don't fight it.
docker build --platform linux/amd64 -t registry/app:latest .4. GPU-Specific Kubernetes Deployment
Your readiness probe fires at second 10. Your model finishes loading at second 55. Traffic arrives. Pod crashes. This is where most GPU deployments fail.
Resource Requests
nvidia.com/gpu: 1— guarantee one GPU per pod- Memory: 4Gi request, 8Gi limit
- nodeSelector: target your GPU node pool
Probes (Where Most People Fail)
- Readiness:
GET /work,initialDelay: 60s - Liveness:
GET /work,initialDelay: 120s,period: 30s
Why 60s readiness? The model needs time to load into GPU memory. An early probe routes traffic to an unready pod — instant 500 errors. Why 120s liveness? Same reason, plus a buffer. Don't let Kubernetes kill a healthy pod that's still initializing.
Other Critical Settings
- Rolling update:
maxSurge 25%,maxUnavailable 25% terminationGracePeriod: 30s(let in-flight requests finish)- tmpfs volume:
emptyDirfor fast temp file I/O - Service:
LoadBalancer, port 80 → 8000
docker push registry/app:latest
kubectl rollout restart deployment/app
kubectl rollout status deployment/app
5. Why Synchronous HTTP Fails — Service Bus Architecture
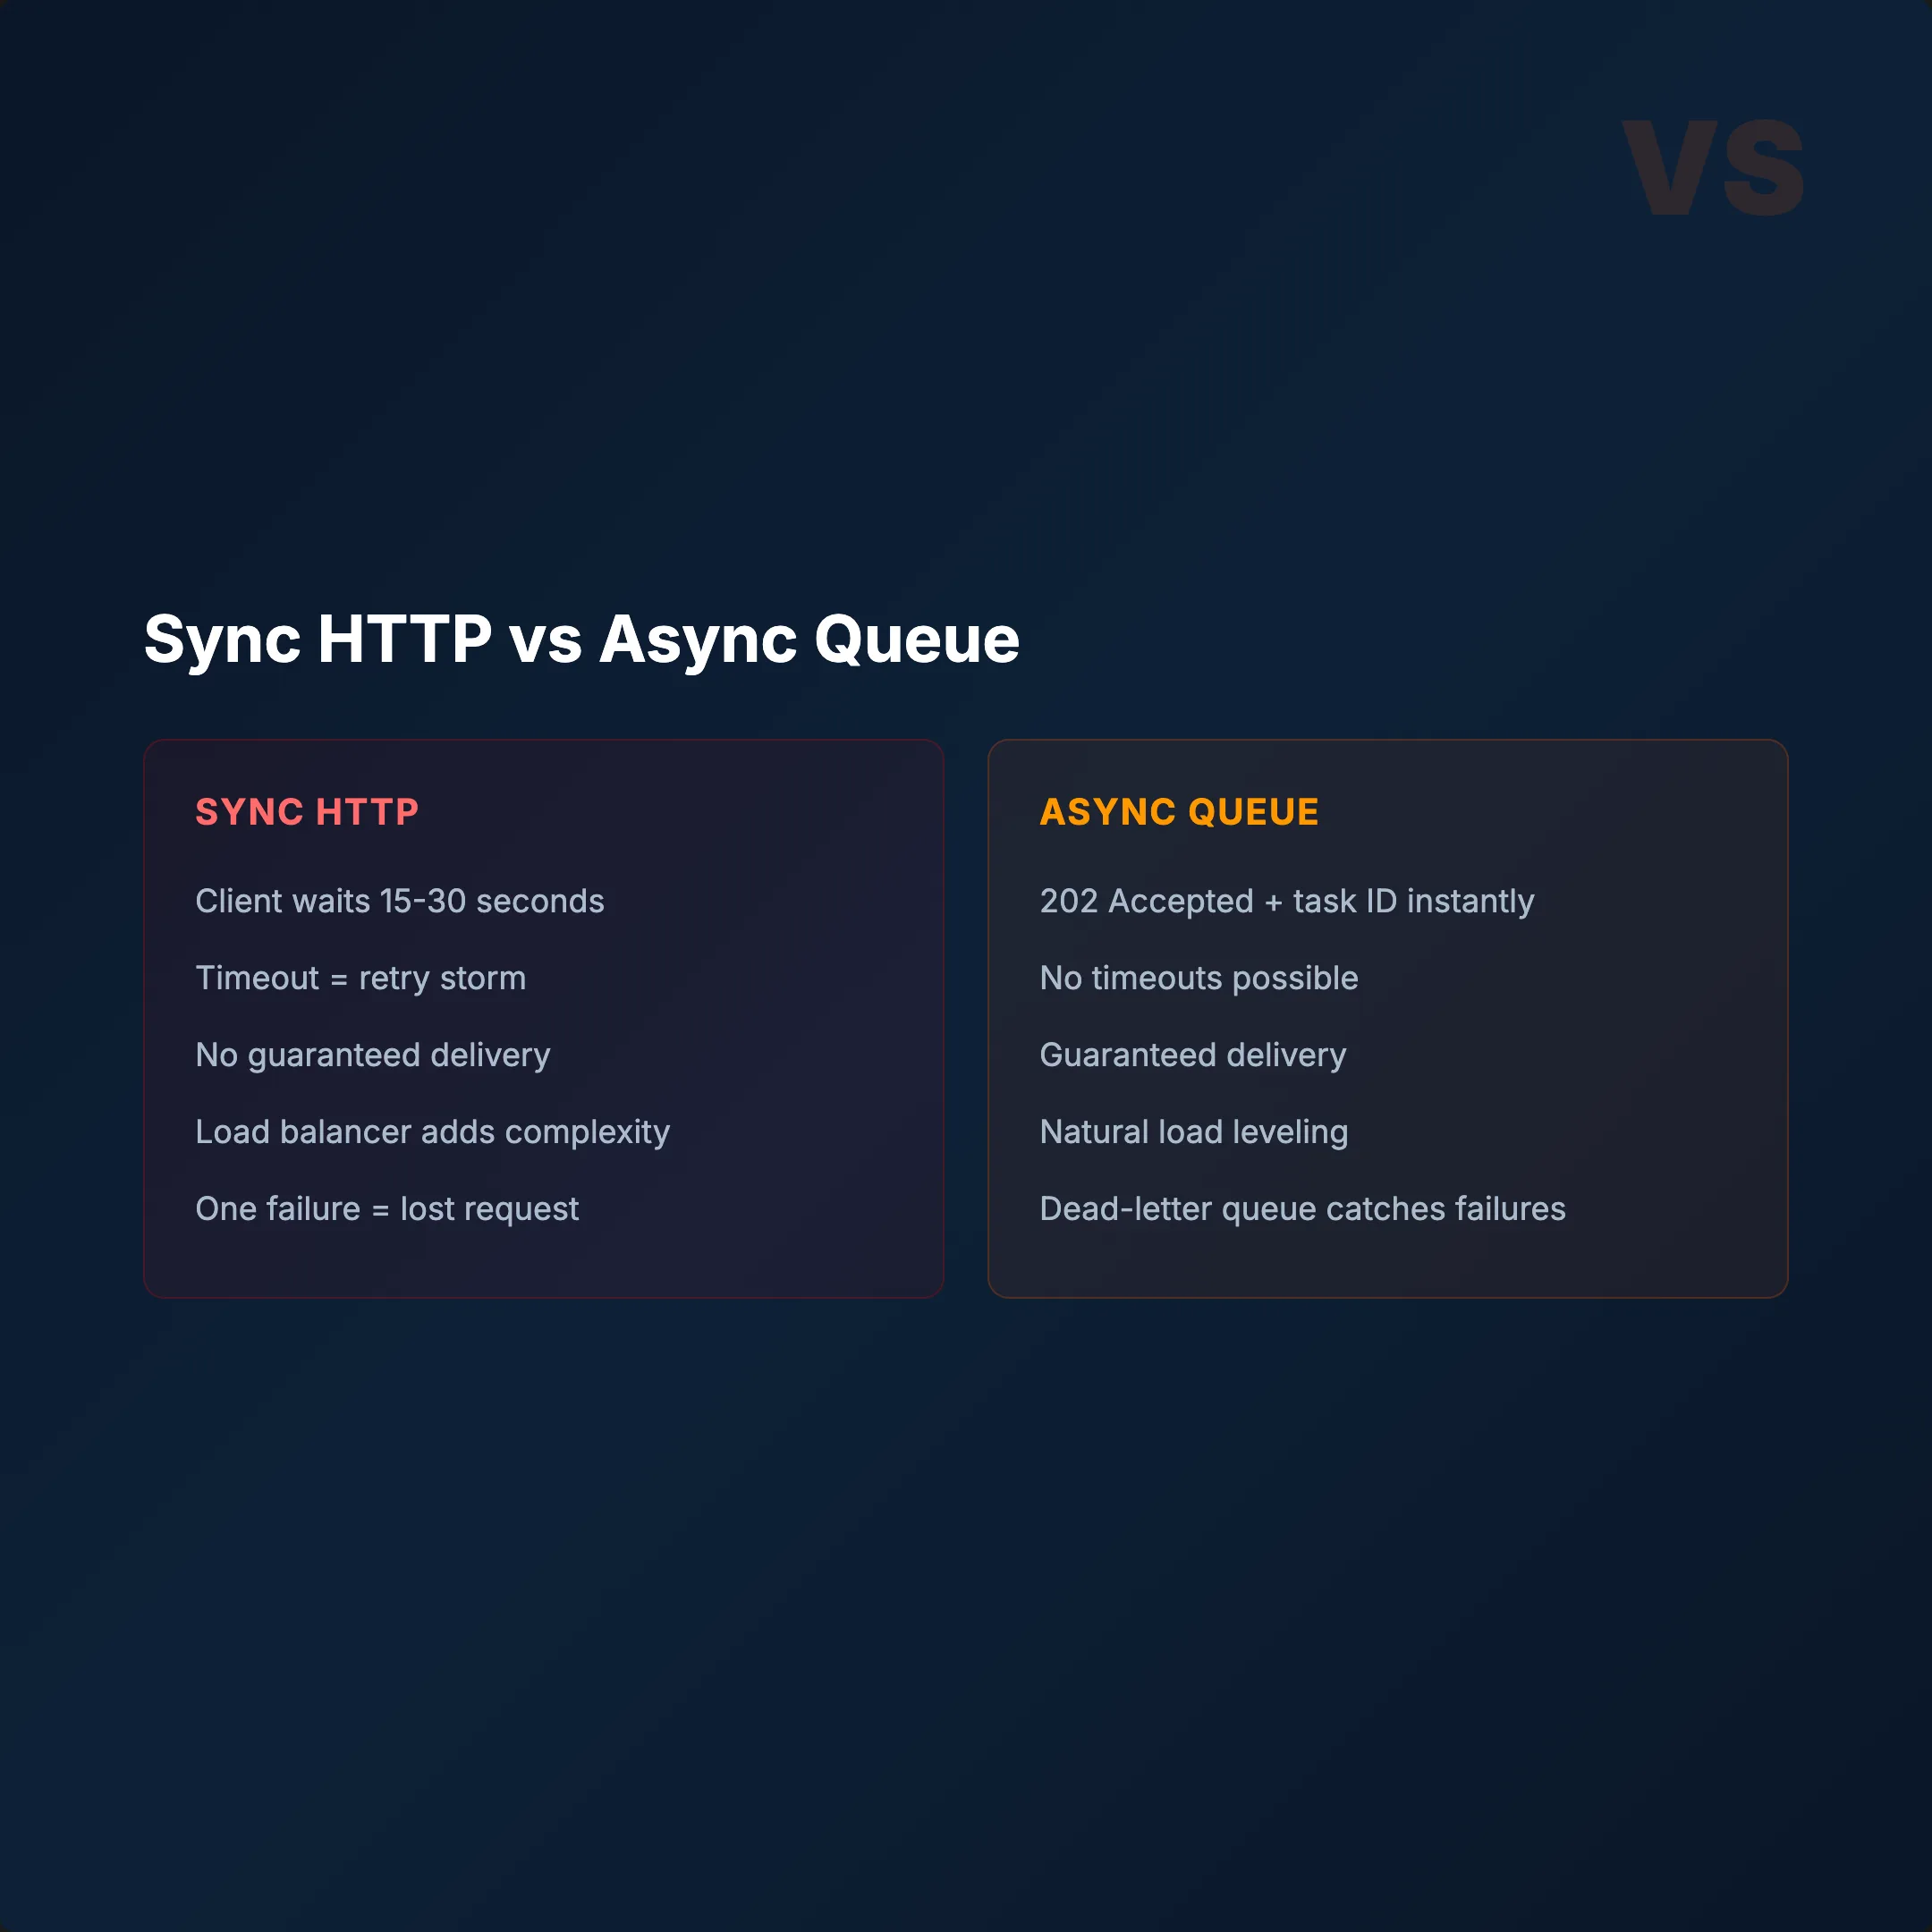
User sends a request. Waits 30 seconds. Times out. Retries. Now you have 3 identical jobs burning GPU resources.
GPU inference takes 10–30 seconds. Synchronous HTTP is the wrong pattern.
The Problem
- Client sends HTTP request
- GPU processes for 15–25 seconds
- Client timeout (usually 30s)
- Client retries automatically
- 2–3 identical jobs running simultaneously
- GPU waste + duplicate results
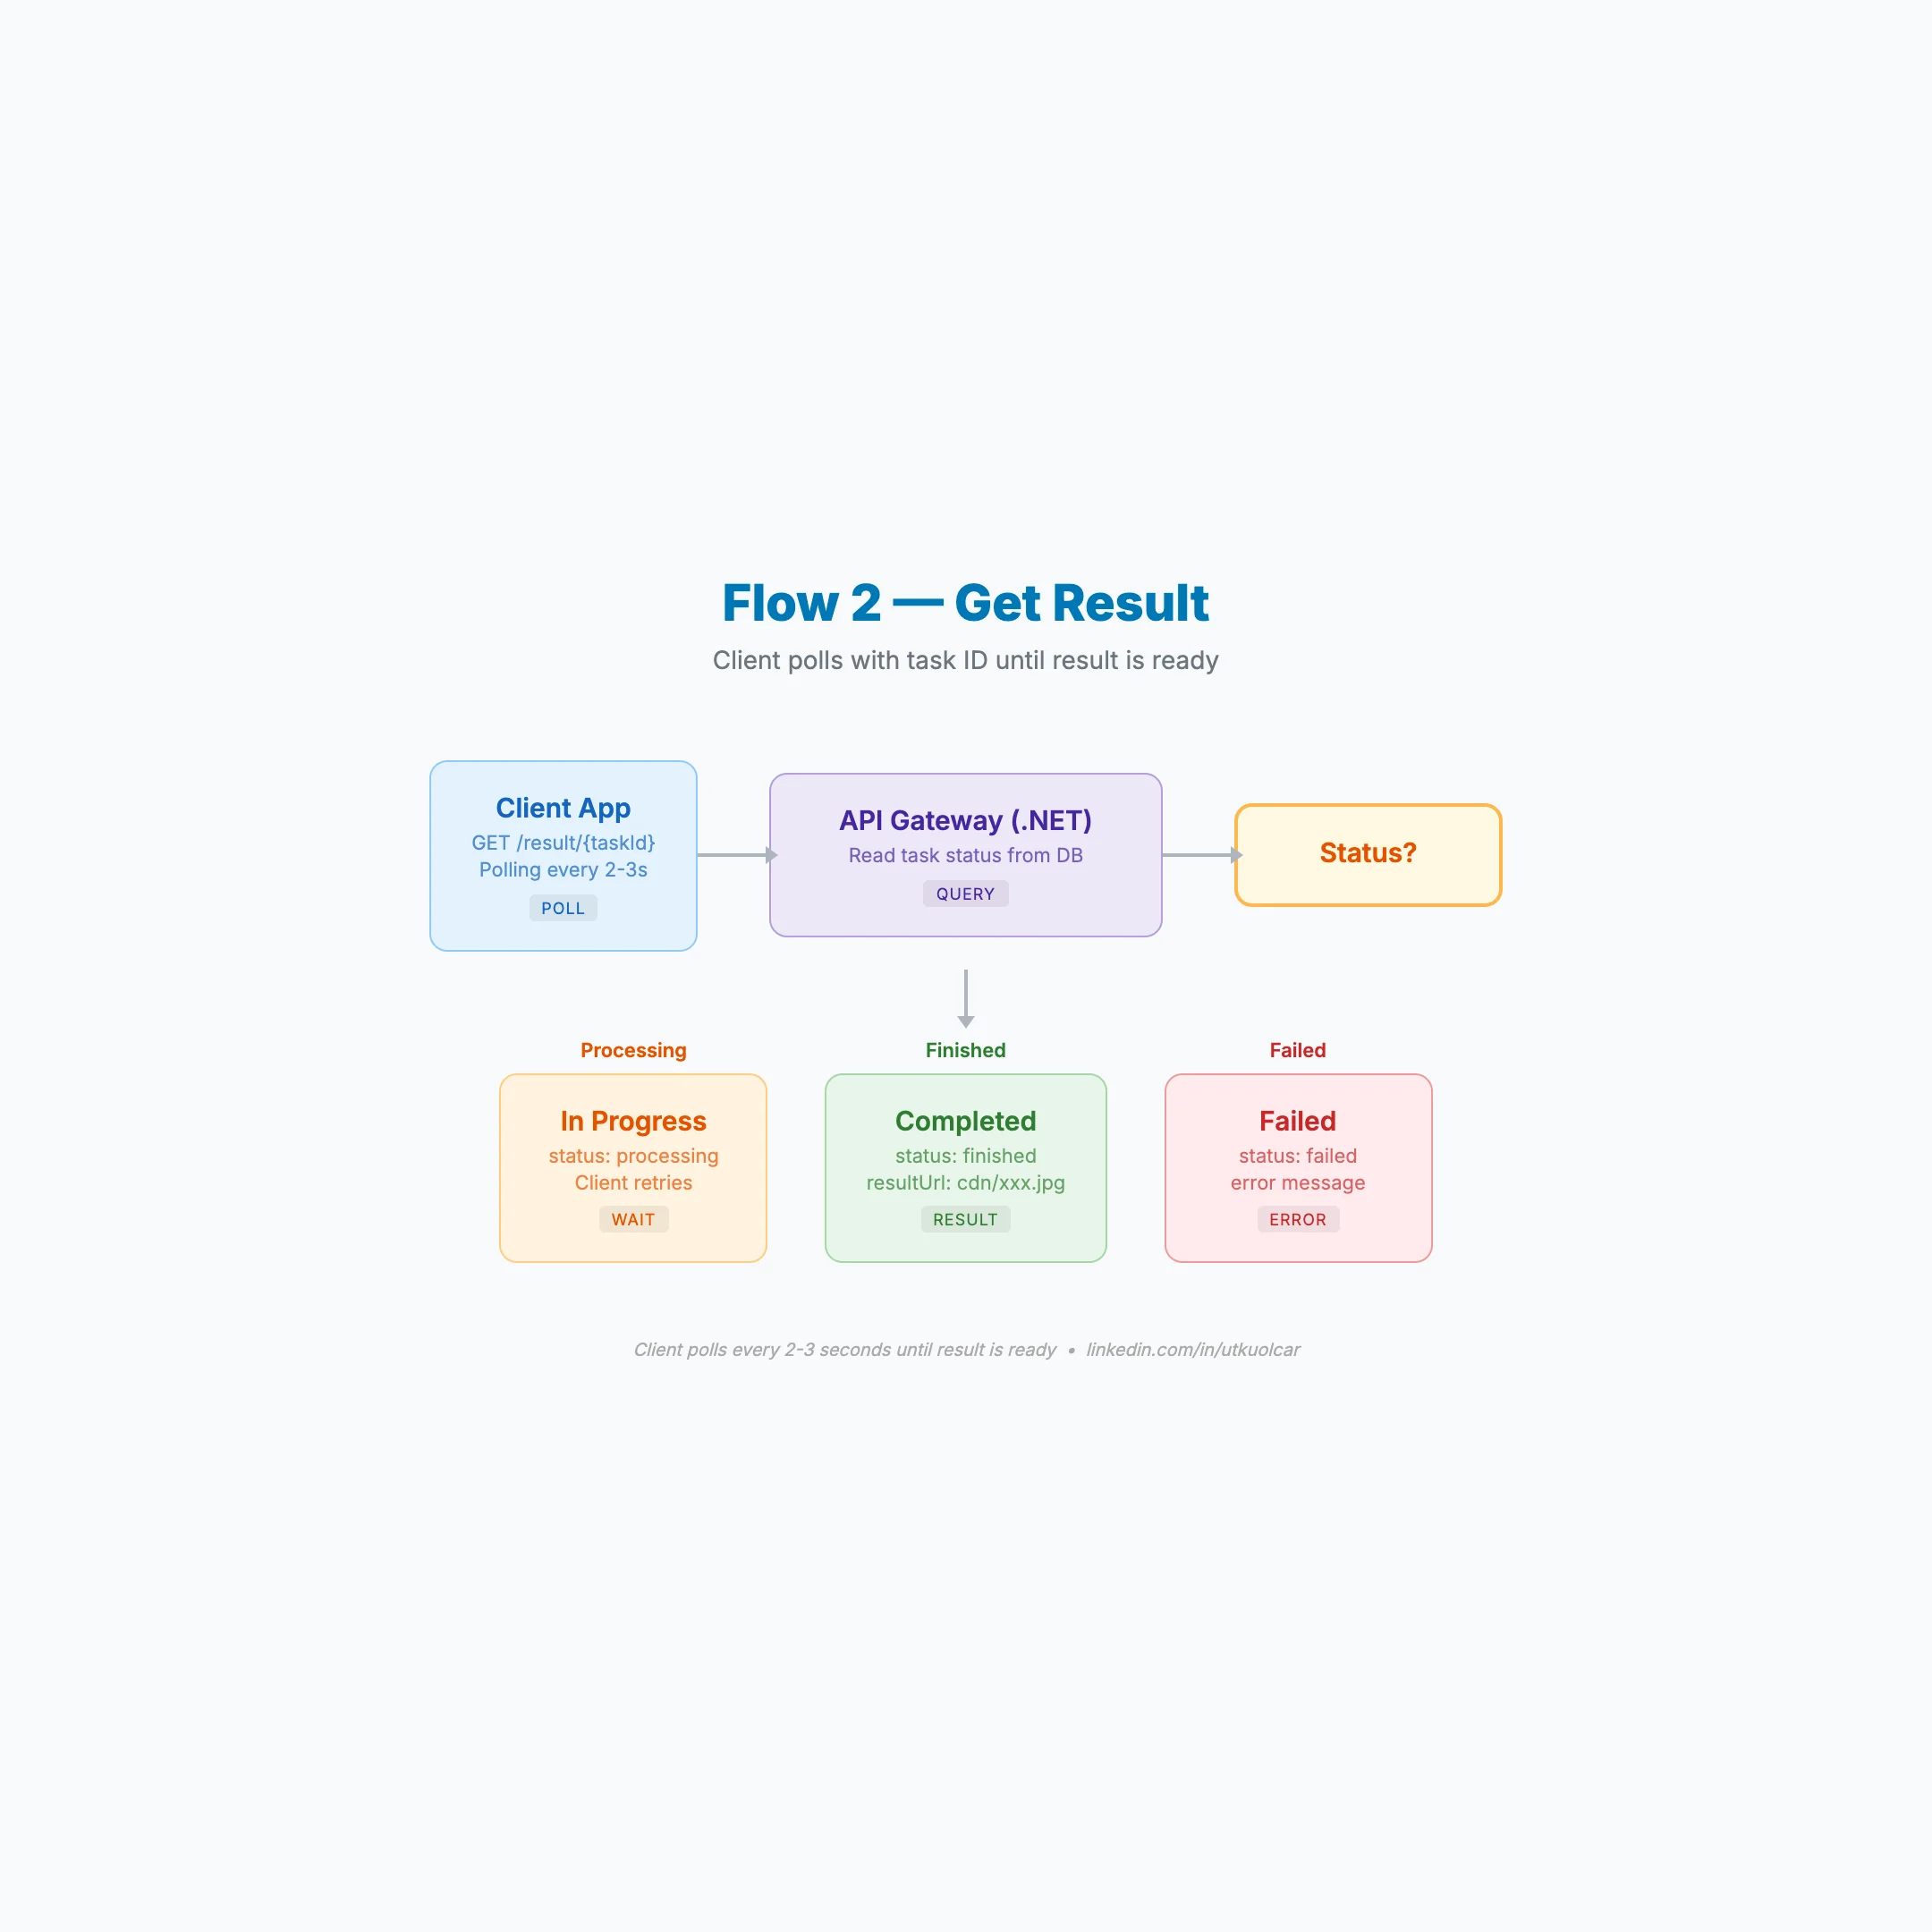
The Fix: Azure Service Bus + Async Queue
- Client sends request → instant
202 Accepted+ task ID - Job goes to Service Bus queue
- Function App picks it up → sends to GPU
- Client polls with task ID until done
Why Service Bus?
- Guaranteed delivery — messages don't get lost
- KEDA integration — 1 message = 1 pod request
- Dead-letter queue — failed jobs auto-separated
- Peek lock — message locked during processing
The queue also provides natural backpressure. When GPUs are overwhelmed, jobs wait in the queue instead of crashing pods.
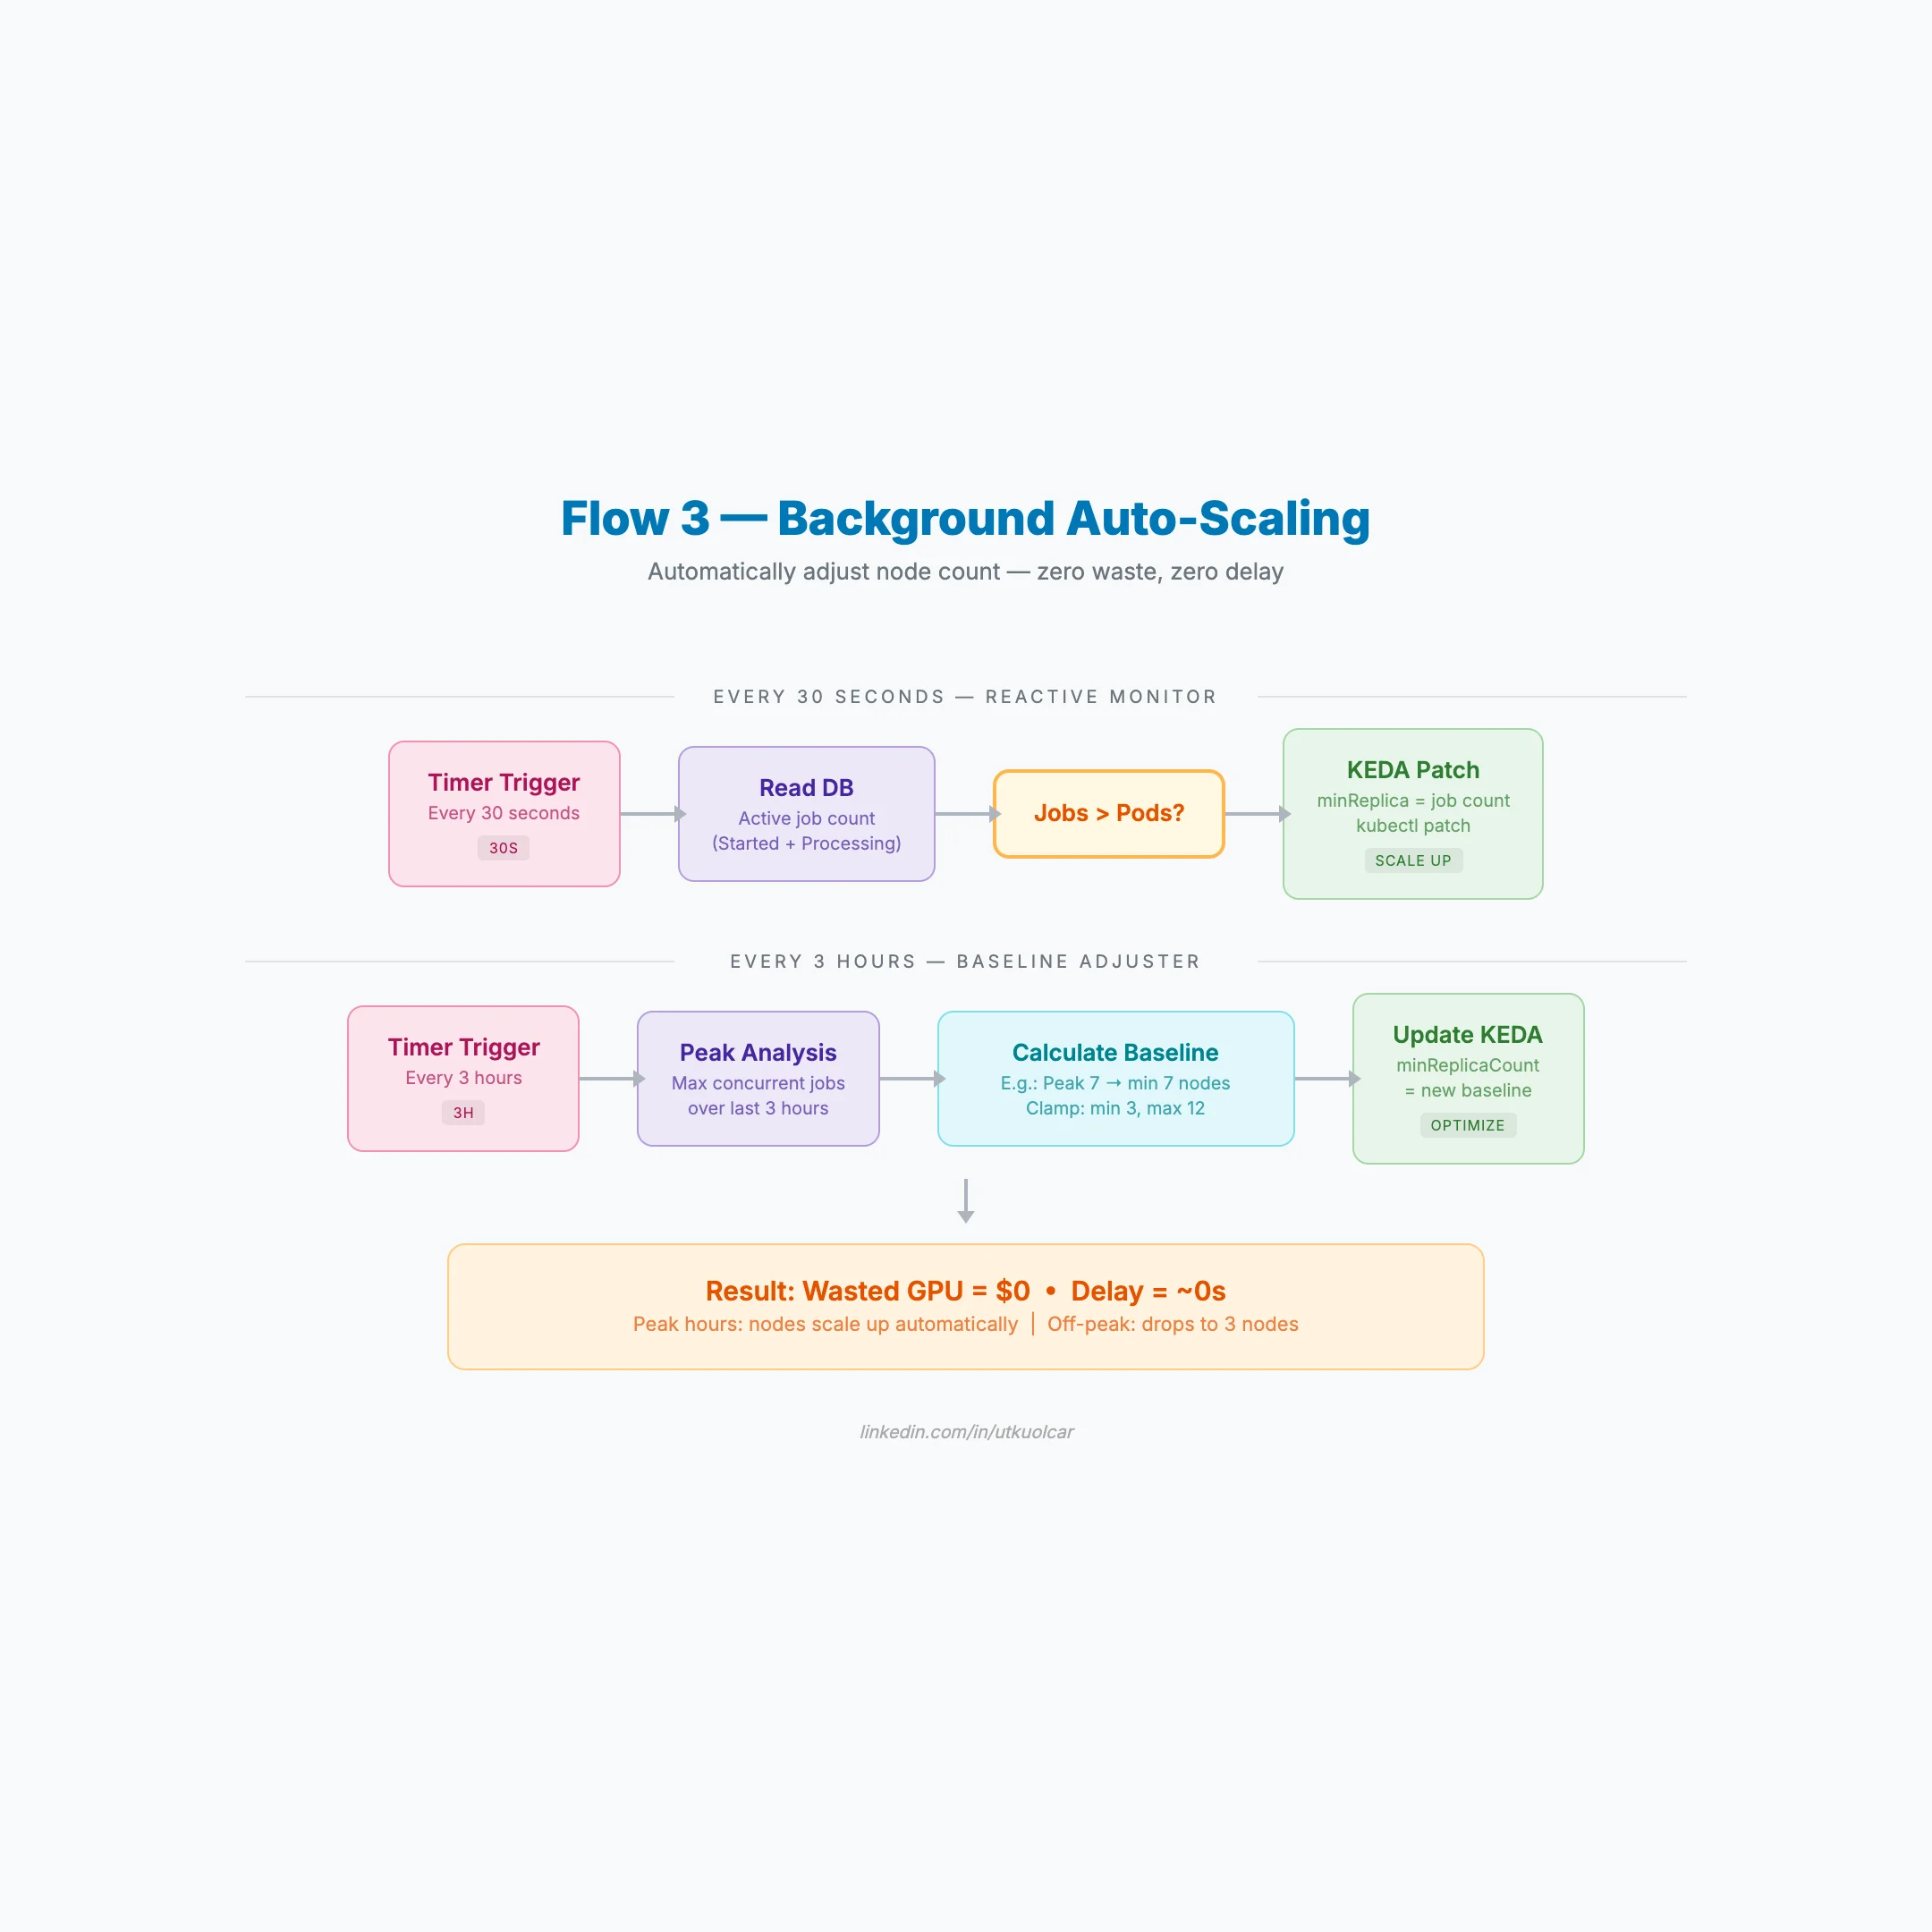
6. 3-Tier Auto-Scaling: Zero GPU Waste
A single HPA doesn't cut it for GPU workloads. We built a 3-tier system orchestrated by an Azure Function App — not just a queue consumer, but the brain of the entire operation.
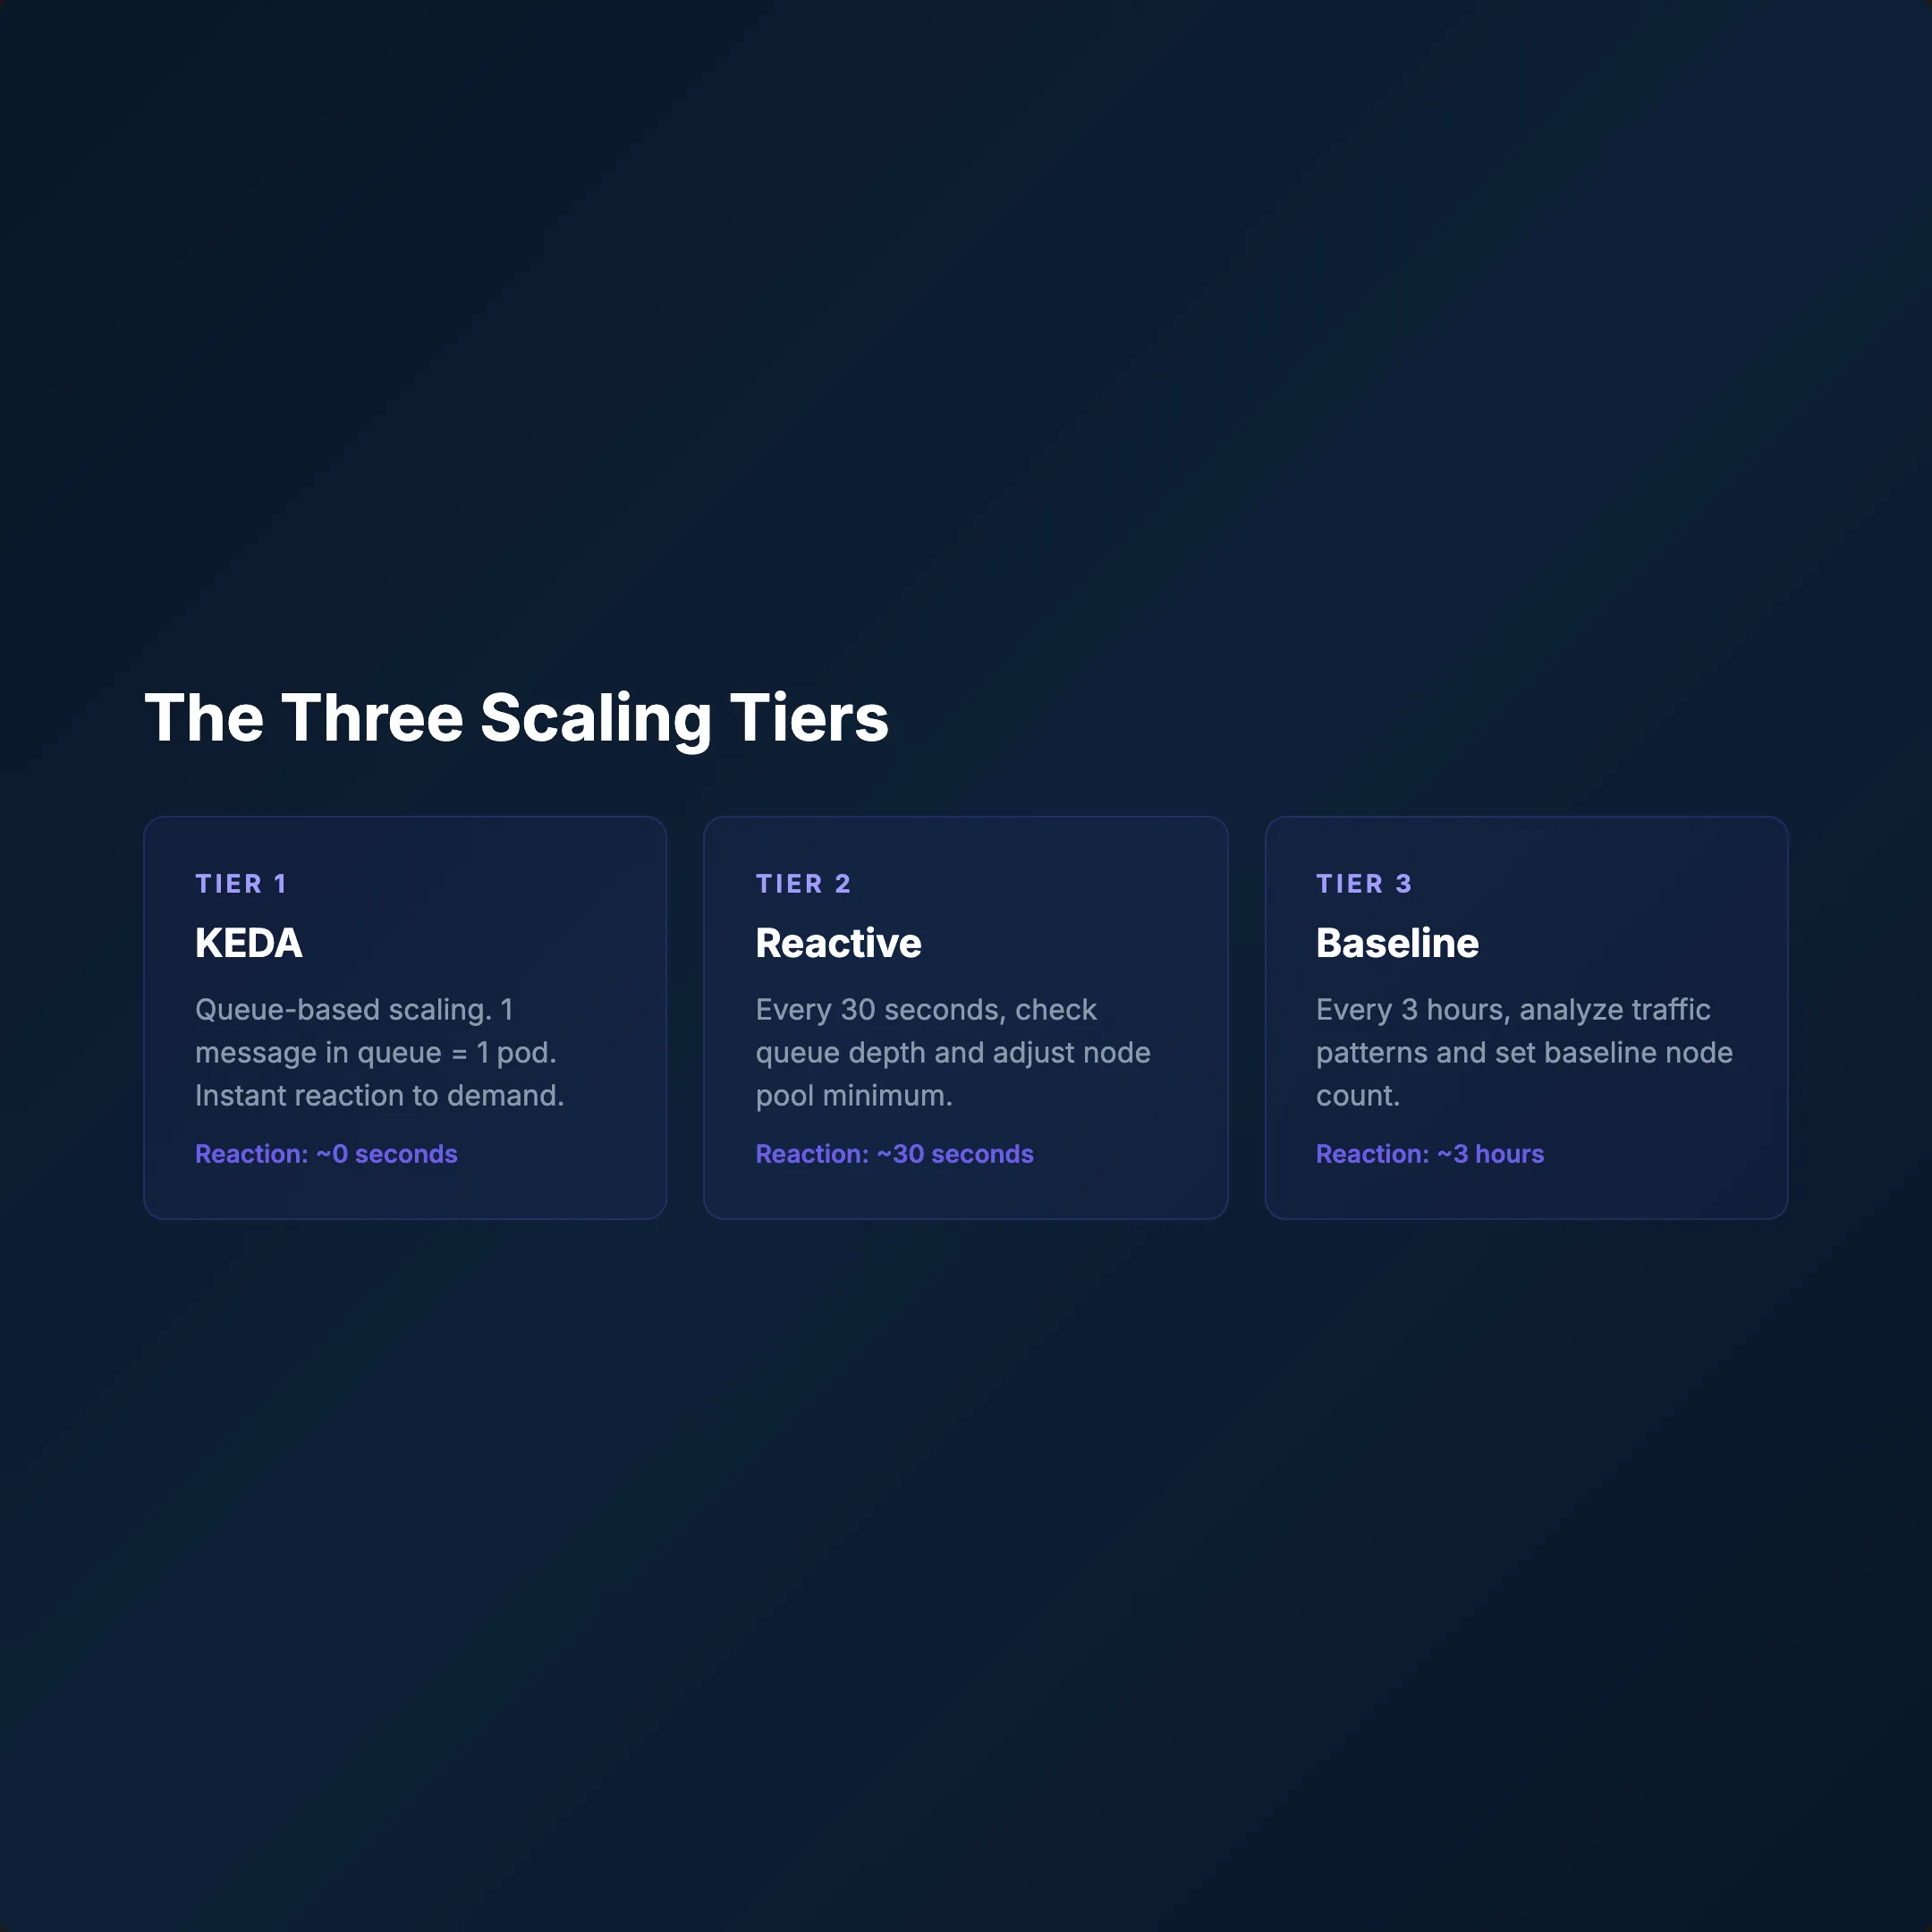
Tier 1 — KEDA (Event-Driven)
Queue depth triggers pods. 1 message = 1 pod request. Response time: seconds.
Tier 2 — Reactive Monitor (Every 30s)
- Reads active job count from the database
- If jobs > pods → immediately patches KEDA
minReplica - New nodes spin up within minutes
- Updates daily peak metric
Tier 3 — Baseline Adjuster (Every 3h)
- Analyzes peak load over the last 3 hours
- Calculates new baseline (min 3, max 12 nodes)
- Updates KEDA
minReplicaCountviakubectl patch
Why 3 Tiers?
- KEDA reacts to queue depth in seconds
- Reactive Monitor catches spikes the queue misses
- Baseline Adjuster prevents unnecessary scale-downs
Mechanism: Function App → Azure Management REST API → kubectl patch. SemaphoreSlim(1,1) prevents race conditions.
Result: Peak → scale up. Off-peak → 3 nodes. Zero GPU waste.
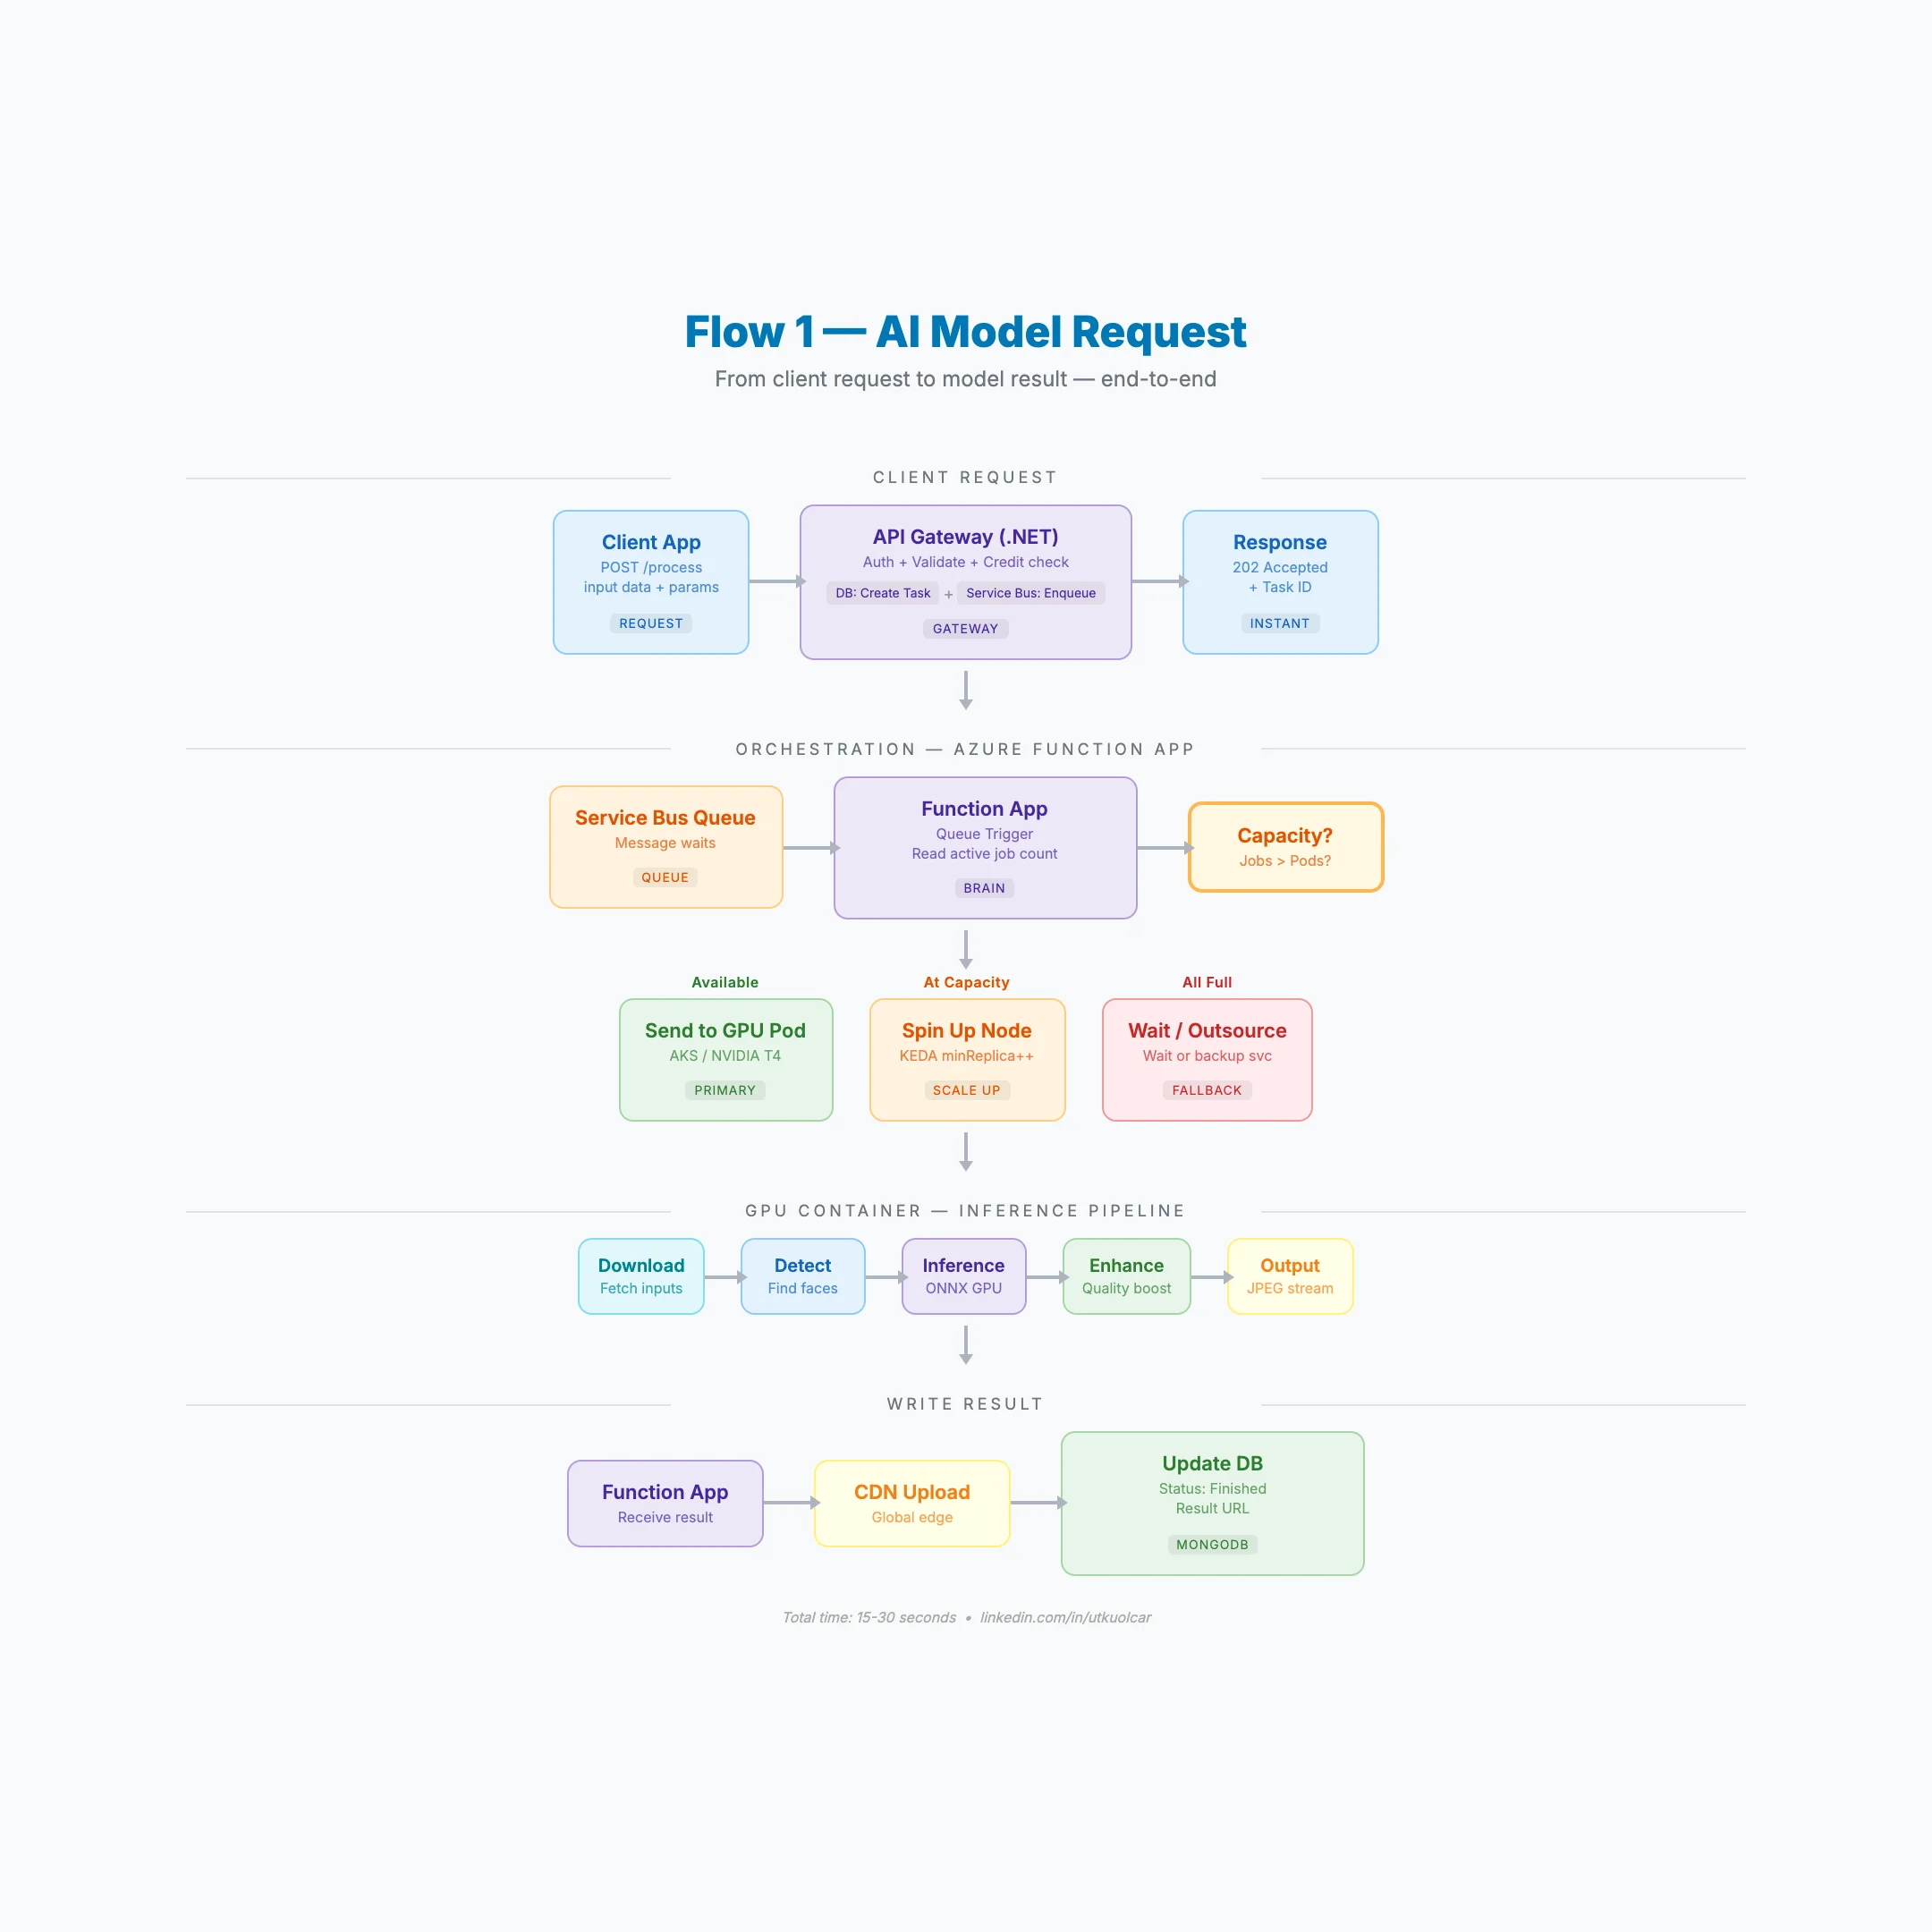
7. End-to-End: The Complete Request Flow
Here's exactly what happens when a request hits the system:
- CLIENT → sends images + parameters to API
- .NET API GATEWAY → validates auth, checks credits
- API → creates task in MongoDB + enqueues to Service Bus → returns
202+ task ID instantly - FUNCTION APP → picks up message → checks GPU capacity
- GPU POD → processes the job:
- Downloads input files
- Runs detection
- Runs inference (ONNX GPU)
- Enhances output quality
- Returns stream
- FUNCTION APP → receives result → CDN upload → DB status: finished
- CLIENT → polls
GET /result/{taskId}→ gets CDN URL
Total time: 15–30 seconds.
Background Jobs Running Continuously
- KEDA watches queue depth
- Reactive Monitor checks every 30s
- Baseline Adjuster recalculates every 3h
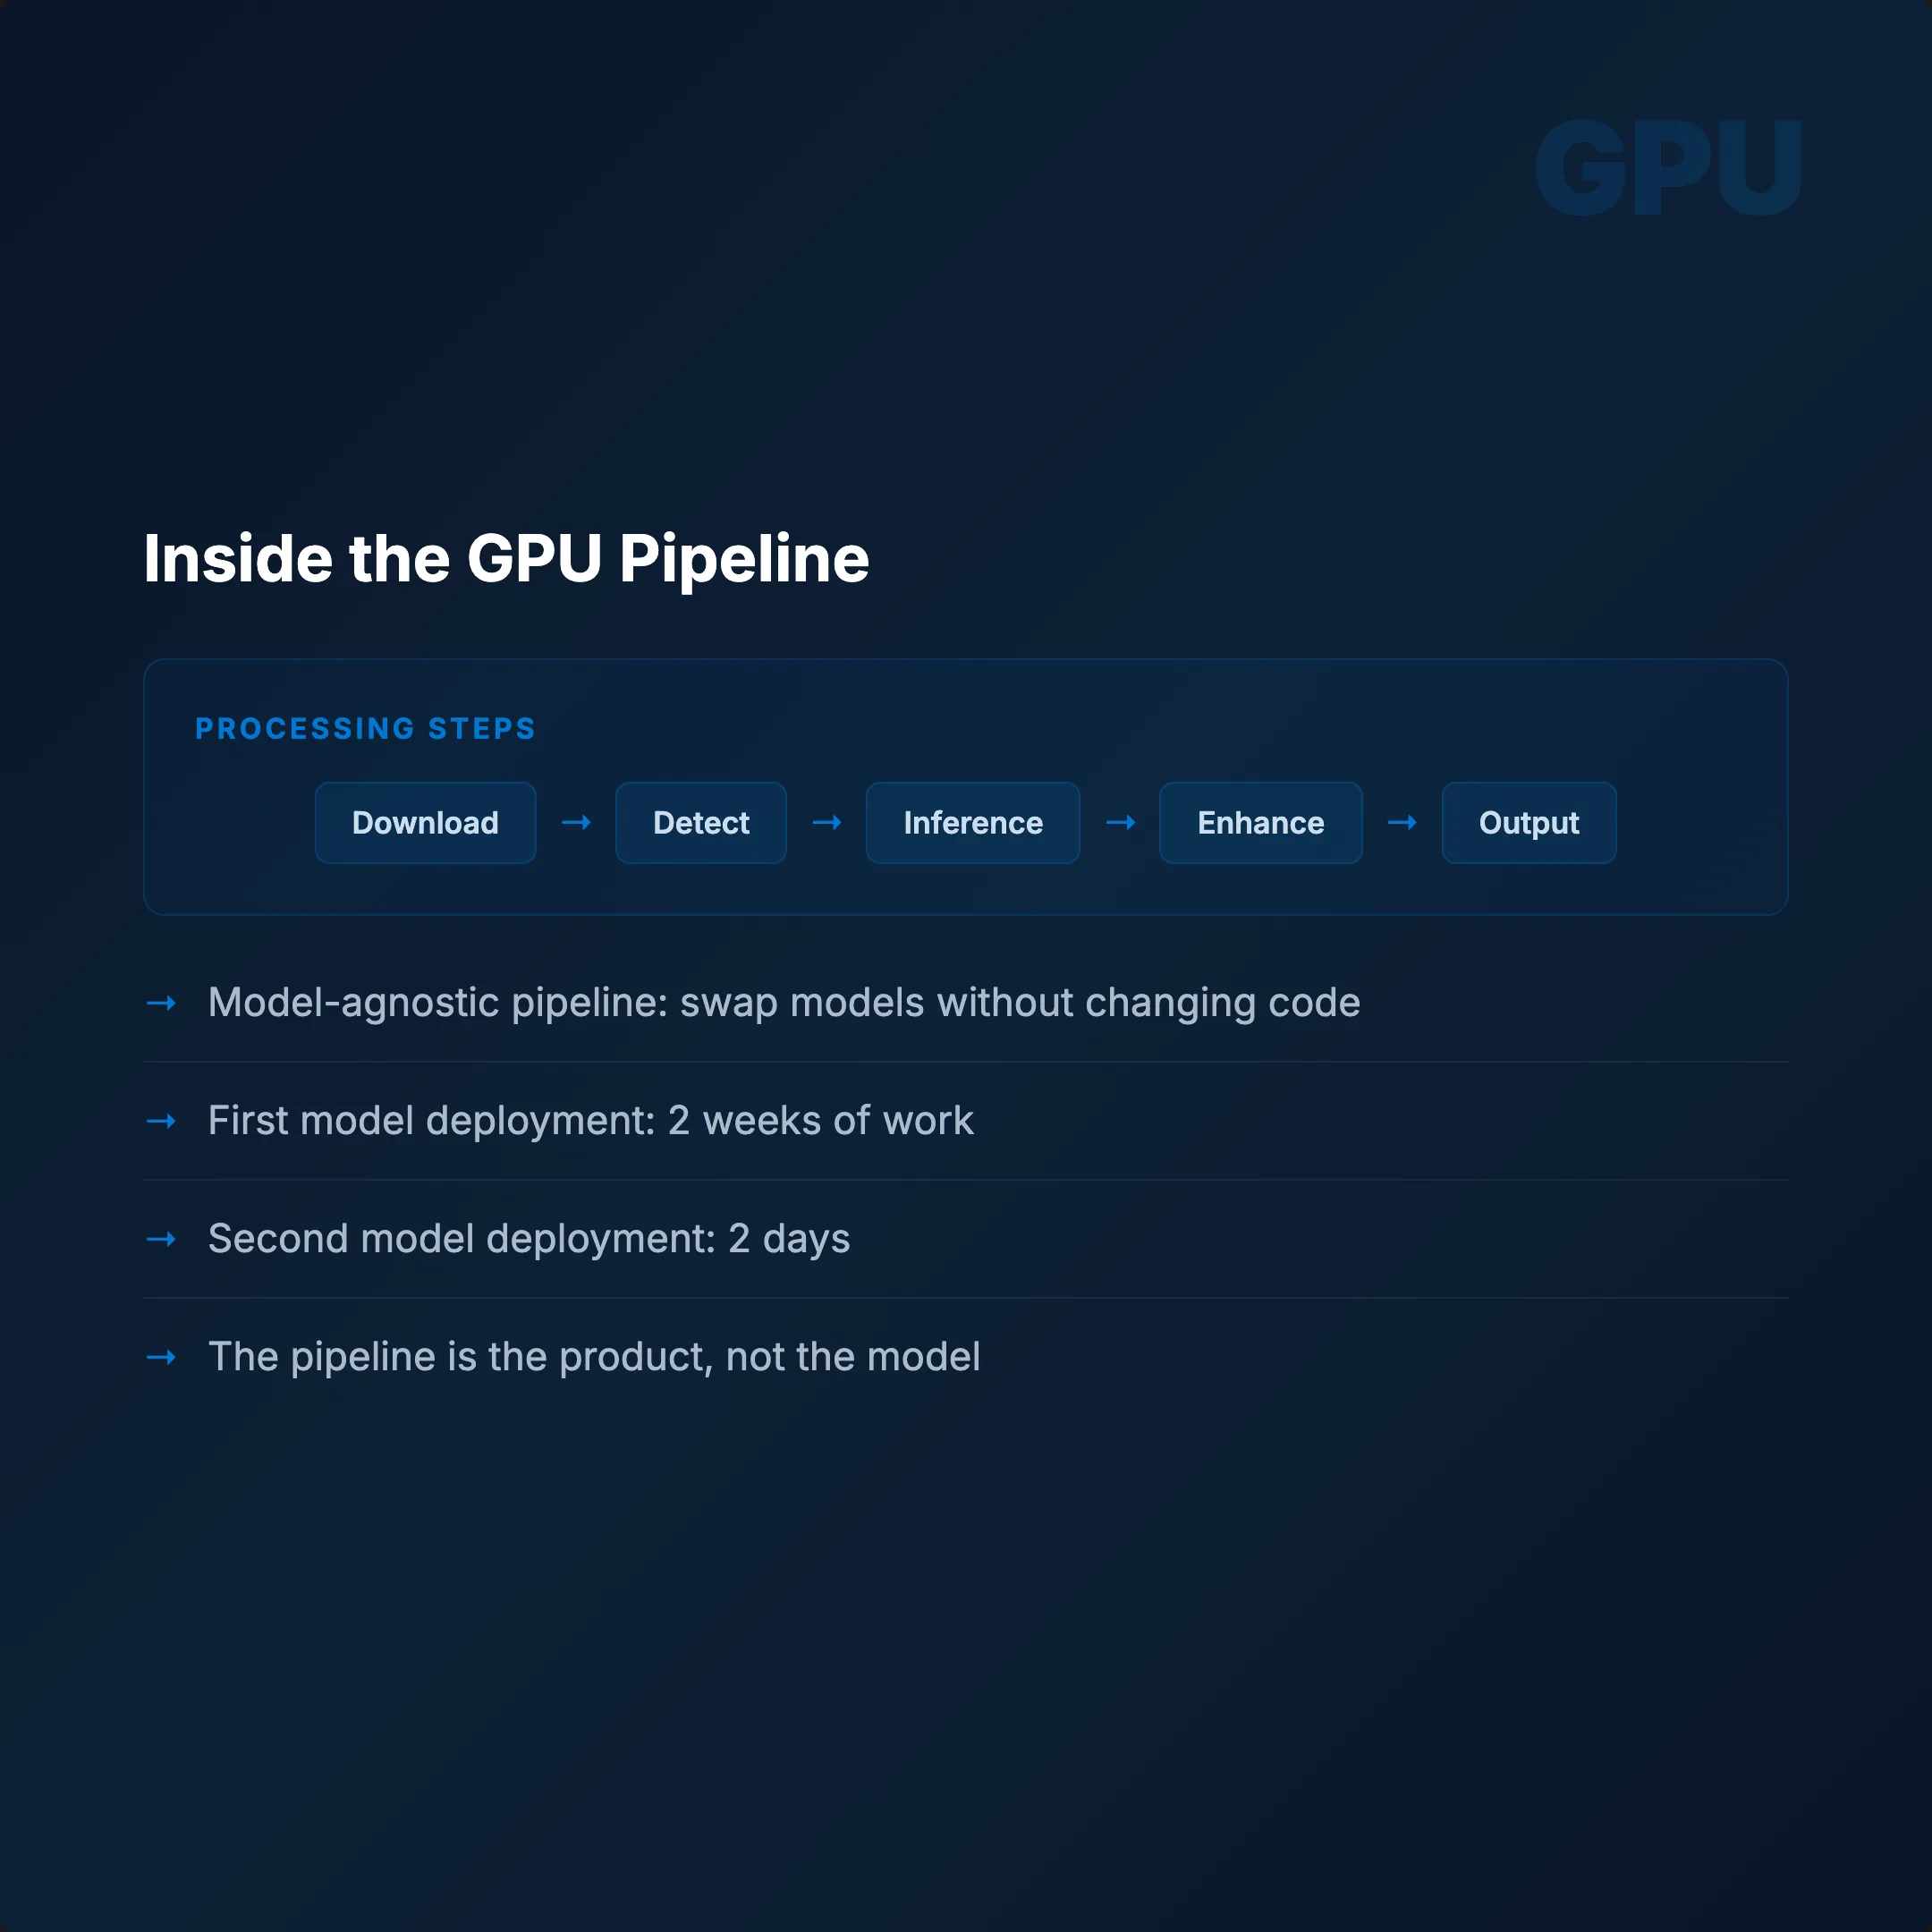
The entire pipeline is model-agnostic. Swap the weights, adjust the endpoint, everything else stays. First model: 2 weeks to deploy. Second model: 2 days. Same Dockerfile. Same manifests. Different weights.
Conclusion
Building a production AI service on Kubernetes isn't just about getting a model to run. It's about building a system that handles failures gracefully, scales precisely, and doesn't burn money on idle GPUs.
The key architectural decisions:
- Separate GPU node pools with proper autoscaler configuration
- Single-worker, semaphore-guarded API containers
- Models baked into Docker images at build time
- Generous probe delays that respect GPU initialization time
- Async queue architecture that eliminates timeout cascades
- 3-tier scaling that reacts in seconds and optimizes over hours
Build the pipeline once. Reuse it forever.